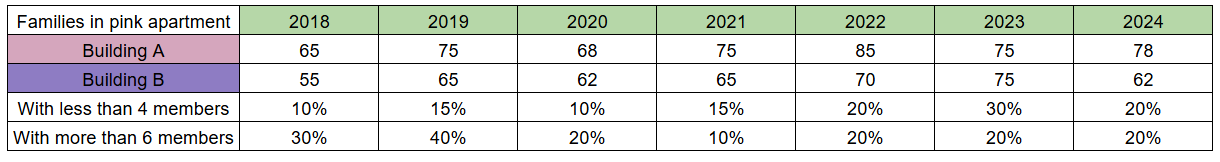
The following table represents data about the number of families residing in buildings A and B of the pink apartment for different years. The table also represents the the number of families with less than 4 members and the number of families with more than 6 members as a percentage of a total number of families in both buildings combined.
Use the data provided in the table above to answer the FOUR questions that follow:
In which of the following years did the number of families with less than 4 members in pink apartments decrease compared to last year?
Solution
We need to check for three options
Option A: In 2021, there were 75+65=140 families in pink apartments, of which 15%, that is, 20 families, had less than 4 members.
Looking at 2020, there were 68+62 = 130 families in pink apartments, of which 10%, that is, 13, had less than 4 members. Hence, 2021 is not our answer.
Option B: In 2023, there were 175+175=150 families in pink apartments, of which 30%, that is, 45 families, had less than 4 members.
Looking at 2022, there were 85 + 70 = 155 members in the pink apartment, of which 20%, that is, 21 families had less than 4 members; hence, this, too, is not our answer.
Option C: In 2024, there were 78+62 = 140 families in pink apartments, 20 of which, that is 28 families, had less than 4 members.
This is a decrease from 45 families in 2023
Of the given options, only 2024 had a lesser number of families with less than 4 members.
Therefore, Option C is the correct answer.
Get AI Help
Create a FREE account and get:
- Download Maths Shortcuts PDF
- Get 300+ previous papers with solutions PDF
- 500+ Online Tests for Free

Book Free CAT Mentorship
Get personalized CAT strategy from a 99%iler
500+ students mentored
OTP Verification
Enter the 6-digit code sent to your phone
Booking Summary
Enter OTP
Didn't receive the OTP?


