Question 106
Study the given graph and answer the question that follows.
The graph shows data related to number of students enrolled for a vocational course in two institutes (X and Y) during three years.
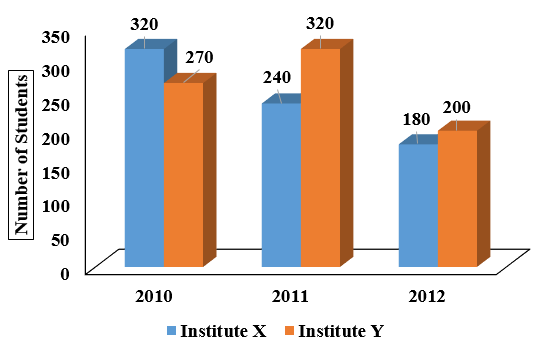
What is the difference between the average number of students enrolled in institute X in 2010 and 2011 and that in institute Y in 2011 and 2012?
Create a FREE account and get:
- Free SSC Study Material - 18000 Questions
- 230+ SSC previous papers with solutions PDF
- 100+ SSC Online Tests for Free


