Join Our JEE Preparation Group
Prep with like-minded aspirants; Get access to free daily tests and study material.
Sign in
Please select an account to continue using cracku.in
↓ →
Join Our JEE Preparation Group
Prep with like-minded aspirants; Get access to free daily tests and study material.
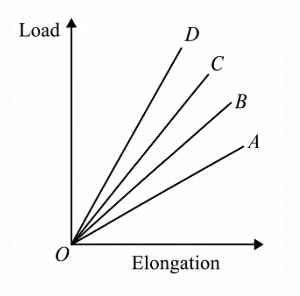
The load versus elongation graphs for four wires of same length and made of the same material are shown in the figure. The thinnest wire is represented by the line
For a uniform wire of length $$L$$, cross-sectional area $$A$$ and Young’s modulus $$Y$$, the elongation $$\Delta L$$ produced by a stretching force (load) $$F$$ is
$$\Delta L=\frac{F\,L}{Y\,A}\qquad -(1)$$
Equation $$-(1)$$ can be rearranged to write the load in terms of the elongation:
$$F=\frac{Y\,A}{L}\,\Delta L\qquad -(2)$$
In a load-elongation graph, the slope is
$$\text{slope}=\frac{F}{\Delta L}=\frac{Y\,A}{L}\qquad -(3)$$
For wires made of the same material ($$Y$$ common) and having the same length ($$L$$ common), the slope is directly proportional to the cross-sectional area $$A$$:
$$\text{slope}\;\propto\;A\qquad -(4)$$
Therefore:
Among the four straight lines shown, line $$OA$$ has the smallest slope (it rises the least in load for a given elongation). Hence, $$OA$$ represents the wire with the smallest cross-sectional area, i.e., the thinnest wire.
Option A which is: $$OA$$
Was this solution helpful?
Click on the Email ☝️ to Watch the Video Solution
Create a FREE account and get:
_1.webp)

Educational materials for JEE preparation

Ask our AI anything

AI can make mistakes. Please verify important information.
AI can make mistakes. Please verify important information.