According to the passage, which of the following statements is not true?
MAT 2006 Question Paper
The National Institute of Oceanography (NIO) in Goa has developed a realtime reporting and Internetaccessible coastal sealevelmonitoring system and it has been operational at Verem jetty in the Mandovi estuary in Goa since September 24, 2005. The gauge uses a cellular modem to put on the Internet realtime sealevel data, which can be accessed by authorised personnel. By using a cellular phone network, coastal sealevel changes are continuously updated on to a webserver. The sealevel gauge website can be made available to television channels to broadcast realtime visualisation of the coastal sea level, particularly during oceanogenic hazards such as storm surges or a tsunami. A network of such gauges along the coast and the islands that lie on either side of the mainland would provide data to disaster management agencies to disseminate warnings to coastal communities and beach tourism centres.
The gauge incorporates a bottom pressure transducer as the sensing element. The sea unit of the gauge, which houses the pressure transducer, is mounted within a cylindrical protective housing, which in turn is rigidly held within a mechanical structure. This structure is secured to a jetty. The gauge is powered by a battery, which is charged by solar panels. Battery, electronics, solar panels, and cellular modems are mounted on the top portion of this structure. The pressure sensor and the logger are continuously powered on, and their electrical current Consumption is 30 mA and 15 mA respectively. The cellular modem consumes 15 mA and 250 mA during standby and data transmission modes, respectively. The pressure sensor located below the lowtide level measures the hydrostatic pressure of the overlying water layer. An indigenously designed and developed microprocessor based data logger interrogates the pressure transducer and acquires the pressure data at the rate of two samples a second. The acquired pressure data is averaged over an interval of five minutes to remove highfrequency windwaves that are superimposed on the lower frequency tidal cycle. This averaged data is recorded in a multimedia card. The measured water pressure is converted to water level using sea water density and acceleration owing to the earth's gravity. The water level so estimated is then referenced to chart datum (CD), which is the internationally accepted reference level below which the sealevel will not, fall. The data received at the Internet server is presented in graphical format together with the predicted sealevel and the residual. The residual sea level (that is, the measured minus the predicted sea level) provides a clear indication of sealevel oscillation and a quantitative estimate of the anomalous behaviour, the driving force for which could be atmospheric forcing (storm) or physical (tsunami).
A network of sealevel gauges along the Indian coastline and islands would also provide useful information to mariners for safe navigation in shallow coastal waters and contribute to various engineering projects associated with coastal zone management, besides dredging operations, port operations and manwater treaties with greater transparency. Among the various communication technologies used for realtime transmission of sealevel data are the wired telephone connections, VHF/UHF transceivers, satellite transmit terminals and cellular connectivity. Wired telephone connections are severely susceptible to loss of connectivity during natural disasters such as storm surges, primarily because of telephone line breakage. Communication via VHF/UHF transceivers is limited by lineofsight distance between transceivers and normally offer only pointtopoint data transfer. Satellite communication via platform transmit terminals (PTTs) has wide coverages and, therefore, allows data reception from offshore platforms. However, data transfer speeds are limited. Further many satellites (for example, GOES, INSAT) permit data transfer only predefined timeslots, thereby inhibiting continuous data access. Technologies of data reporting via satellites have undergone a sea change recently in terms of frequency of reportage, data size, recurring costs and so forth. Broadband technology has been identified as one that can be used optimally for realtime reporting of data because of its inherent advantages such as a continuous twoday connection that allows highspeed data transfer and near realtime data reporting. While satellite communication is expensive, wireless communication infrastructure and the ubiquity of cellular phones have made cellular communication affordable. Low initial and recurring costs are an important advantage of cellular communication. A simple and costeffective methodology for realtime reporting of data is the cellularbased GPRS technology, with has been recently implemented at the NIO for realtime reporting of coastal sea level data.
What is the outermost part of the sea unit of the gauge?
What is the limitation of satellite communication via platform transmit terminals?
Which one of the following relationships is correct as per the passage?
The World Trade Organisation (WTO) Ministerial Conference, which commenced in Hong Kong on December 13, 2005 adopted a declaration on December 18, 2005 after six days of acrimonious negotiations between developed and developing countries. Although initially there was a show of unity among developing countries especially on the issue of agriculture, which was reflected in the formation of the G110, the final outcome of the Ministerial Declaration has been thoroughly antidevelopment. The Ministerial Declaration has not only failed to address substantially the concerns of developing countries but has actually paved the way for an eventual trade deal by the end of 2006, which is going to be severely detrimental to their interests. It is clear by now that the socalled "Development Round" launched in Doha in 2001 has been manipulated by developed countries, especially the United States and the members of the European Union, to push for further trade liberalisation in developing countries while they continue to protect their economies through high subsidies and nontariff barriers. Far from redressing the asymmetries of the global trading system, the Doha round seems to be heading for another catastrophe for the developing world. The EU stuck to its intransigent position on the deadline of 2013 for the elimination of export subsidies and developing countries gave up their demand for an earlier end date despite the initial collective efforts of the G110. The gross inadequacy of this socalled "concession" can be understood from the fact that export subsidies comprise less than 2 per cent of the total farm subsidies in the developed world. There has been no concrete commitment on the reduction of domestic support other than export subsidies. The EU can continue to subsidise agriculture to the tune of 55 billion euros a year. The EU budget adopted recently ensures that nothing can be touched in the agriculture budget till at least 2013. The US budget reconciliation process and the final vote in the Congress are set to extend domestic support to agriculture and countercyclical support to commodities up to around 2011. Even in the case of cotton, the agreement to eliminate subsidies by 2006 is restricted to export subsidies only and does not include other forms of domestic support. The US refused to give dutyfree access to exports from LeastDeveloped Countries (LDCs) for 99.9 per cent of product lines and the final agreement was on 97 per cent of them, which would enable the US and Japan to deny market access to LDCs in product lines such as rice and textiles. Much of the Aid for Trade for LDCs, which is being showcased by developed countries as a "development package", is disguised in conditional loan packages that are contingent upon further opening up of their markets. India's prime interest in agriculture was to ensure the protection of its small and marginal farmers from the onslaught of artificially lowpriced imports or threats thereof. The proposals for agricultural tariff cuts, which are already on the table, are quite ambitious and the G20 has already committed itself to undertake cuts to the extent of twothirds of the level applicable to developed countries. Moreover, India has 100 per cent tariff lines bound in agriculture with the difference in the applied level and the bound level not very marked in many lines. In this context, the systemic problem face by India's small and marginal farmers practising subsistence agriculture will only get aggravated as a result of the impending tariff cuts that have been agreed upon. The government claims that the right to designate a number of agricultural product lines as special products based upon the consideration of food and livelihood security and to establish a special safeguard mechanism based on import quantity and price triggers, which have been mentioned in the Ministerial Text, adequately addresses the concerns of Indian farmers. The claim is questionable since the nature as well as the extent of protection under the category of special products remains restricted and the special safeguard mechanism, admittedly, is a measure to deal with an emergency and is of "a temporary nature". Therefore, seen in the light of the insignificant reductions in domestic farm subsidies by developed countries, tariff reduction commitments by developing countries seem to be totally unjustifiable. Developing countries have also agreed on the Swiss formula for tariff cuts under NonAgricultural Market Access (NAMA). Although the coefficients will be negotiated later, it is unlikely that developed countries will agree upon sufficiently large coefficients for the formula that would ensure adequate policy space for developing countries in future to facilitate development of different sectors of their industries. The Ministerial Text's ritual references to "less than full reciprocity" and "special and differential treatment" fails to conceal the fact that the flexibilities provided by the July framework regarding the nature of the tariff reduction formula, product coverage, the extent of binding and the depth of cuts have been done away with. Moreover, no concrete commitment has been obtained in the Ministerial Text for the removal of the NonTariff barriers by developed countries, which is their principal mode of protection, despite developing countries making such major concessions on industrial tariff cuts. The fact of the matter is that developing countries have committed themselves to cuts in both agricultural and industrial tariffs, without getting anything substantial in return from developed countries. And India has facilitated the adoption of this bad deal in the backdrop of an acute crisis faced by Indian agriculture. Unfortunately, developing countries have lost the opportunity to rework fundamentally the iniquitous Agreement on Agriculture and protect the domestic policy space visàvis industrial protection by developing countries, which could have been achieved by galvanising the unity of the G110.
What was/were the flexibility/flexibilities envisaged by the July framework?
Which one of the following statements is not correct as per the passage?
Which claim of the Indian Government is questionable?
Why is it that the imbalances of the global trading system appear to be catastrophic?
It is easy to accept Freud as an applied scientist, and, indeed he is widely regarded as the twentieth century's master clinician. However, in viewing Marx as an applied social scientist, the stance needed is that of a Machiavellian operationalism. The objective is neither to bury nor to praise him. The assumption is simply that he is better understood for being understood as an applied sociologist. This is in part the clear implication of Marx's Theses on Feurbach, which culminate in the resounding 11th thesis: "The philosophers have only interpreted the world in different ways; the point, however, is to change it". This would seem to be the tacit creed of applied scientists everywhere. Marx was no Faustian, concerned solely with understanding society, but a Promethean who sought to understand it well enough to influence and to change it. He was centrally concerned with the social problems of a lay group, the proletariat, and there can be little doubt that his work is motivated by an effort to reduce, their suffering, as he saw it. His diagnosis was that their increasing misery and alienation engendered endemic class struggle; his prognosis claimed that this would culminate in revolution; his therapeutic prescription was class consciousness and active struggle. Here, as in assessing Durkheim or Freud, the issue is not whether this analysis is empirically correct or scientifically adequate. Furthermore, whether or not this formulation seems to eviscerate Marx's revolutionary core, as critics on the left may charge, or whether the formulation provides Marx with a new veneer of academic respectability, as critics on the right may allege, is entirely irrelevant from the present standpoint. Insofar as Marx's or any other social scientist's work conforms to a generalised model of applied social science, insofar as it is professionally oriented to the values and social problems of laymen in his society, he may be treated as an applied social scientist. Despite Durkheim's intellectualistic proclivities and rationalistic pathos, he was too much the product of European turbulence to turn his back on the travail of his culture. "Why strive for knowledge of reality, if this knowledge cannot aid us in life", he asked. "Social science", he said, "can provide us with rules of action for the future". Durkheim, like Marx, conceived of science as an agency of social action, and like him was professionally oriented to the values and problems of laymen in his society. Unless one sees that Durkheim was in some part an applied social scientist, it is impossible to understand why he concludes his monumental study of Suicide with a chapter on "Practical Consequences", and why, in the Division of Labour, he proposes a specific remedy for anomie. Durkheim is today widely regarded as a model of theoretic and methodologic sophistication, and is thus usually seen only in his capacity as a pure social scientist. Surely this is an incomplete view of the man who regarded the practical effectiveness of a science as its principal justification. To be more fully understood, Durkheim also needs to be seen as an applied sociologist. His interest in religious beliefs and organisation, in crime and penology, in educational methods and organisation, in suicide and anomie, are not casually chosen problem areas. Nor did he select them only because they provided occasions for the development of his theoretical orientation. These areas were in his time, as they are today, problems of indigenous interest to applied sociologist in Western Society, precisely because of their practical significance.
Which of the following best describes the author's conception of an applied social scientist?
According to the author, which of the following did Marx and Durkheim have in common?
It may be inferred from the passage that the applied social scientist might be interested in all of the following subjects except
Which of the following best summarises the author's main point?
Solution
The passage discusses how both Marx and Durkheim should be viewed as applied social scientists due to their focus on addressing social issues and problems faced by society.
The author emphasizes that their work was motivated by a desire to influence and change societal conditions, rather than merely understanding them in a theoretical sense.
This aligns with the idea that both figures were engaged in practical applications of their theories to improve the lives of people, particularly those in distressing social situations.
Unemployment is an important index of economic slack and lost output, but it is muchmore than that. For the unemployed person, it is often a damaging affront to human dignity and sometimes a catastrophic blow to family life. Nor is this cost distributed in proportion to ability to bear it. It falls most heavily on the young, the semiskilled and unskilled, the black person, the older worker, and the underemployed peeson in a low income rural area who is denied the option of securing more rewarding urban employment.
The concentrated incidence of unemployment among specific groups in the population means far greater costs to society that can be measured simply in hours of involuntary idleness of dollars of income lost. The extra costs include disruption of the careers of young people, increased juvenile delinquency, and perpetuation of conditions which breed racial discrimination in employment and otherwise deny equality of opportunity. There is another and more subtle cost. The social and economic strains of prolonged underutilisation create strong pressures for costincreasing solutions. On the side of labour, prolonged high unemployment leads to "sharethework" pressures for shorter hours, intensifies resistance to technological change and to rationalisation of work rules, and, in general, increases incentives for restrictive and inefficient measures to protect existing jobs. On the side of business, the weakness of markets leads to attempts to raise prices to cover high average overhead costs and to pressures for protection against foreign and domestic competition. On the side of agriculture, higher prices are necessary to achieve income objectives when urban and industrial demand for foods and fibers is depressed and lack of opportunities for jobs and higher incomes in industry keep people on the farm. In all these cases, the problems are real and the claims understandable. But the solutions suggested raise costs and promote inefficiency. By no means the least of the advantages of full utilisation will be a diminution of these pressures. They will be weaker, and they can be more firmly resisted in good conscience, when markets are generally strong and job opportunities are plentiful. The demand for labour is derived from the demand for the goods and services which labour participates in producing. Thus, unemployment will be reduced to 4 per cent of the labour force only when the demand for the myriad of goods and services―automobiles, clothing, food, haircuts, electric generators, highways, and so on--is sufficiently great in total to require the productive efforts of 96 per cent of the civilian labour force. Although, many goods are initially produced as materials or components to meet demands related to the further production of other goods, all goods (and services) are ultimately destined to satisfy demands that can, for convenience, be classified into four categories; consumer demand, business demand for new plants and machinery and for additions to inventories, net export demand of foreign buyers, and demand of government units, federal, state and local. Thus gross national product (GNP), our total output, is the sum of four major components of expenditure; personnel consumption expenditures, gross private domestic investment, net exports and government purchases of goods and services. The primary line of attack on the problem of unemployment must be through measures which will expand one or more of these components of demand. Once a satisfactory level of employment has been achieved in a growing economy, economic stability requires the maintenance of a continuing balance between growing productive capacity and growing demand. Action to expand demand is called for not only when demand actually declines and recession appears but even when the rate of growth of demand falls short of the rate of growth of capacity.
According to the passage, unemployment is an index of
Serious unemployment leads labour groups to demand
Solution
Serious unemployment leads labour groups to demand more jobs by having everyone work shorter hours.
This is in reference to the "share-the-work" pressures, which are a response to prolonged high unemployment, leading labor groups to advocate for shorter work hours in order to spread employment among a larger number of people.
According to the passage, a typical business reaction to a recession is to press for
The demand for labour is
Solution
The demand for labor is best described as A derived demand. This means that the demand for labor is contingent upon the demand for the goods and services that labor helps to produce.
As stated in the text, "The demand for labor is derived from the demand for the goods and services which labor participates in producing," indicating that labor demand is dependent on overall economic activity and consumer needs.
Pick out the effective pair of words from the given choices A, B, C and D in each of these questions to make the sentence meaningfully complete.
Part of the confusion in our societies _______ from our pursuit of efficiency and economic growth, in the _______ that these are the necessary ingredients of progress.
The problem of housing shortage _______ with the population explosion has also been ______ by this policy.
The quality of _______ between individuals and the organisation for which they work can be ________ to the benefit of both parties.
Handicrafts constitute an important _______ of the decentralised sector of India's economy and _______ employment to over six million artisans.
In each of these questions, there are three sentences given as (A), (B) and (C). Find out which two or three sentences convey the same meaning.
(A) The manager would like you to help him locate the fault.
(B) If you help him locate the fault, the Manager would like you.
(C) The Manager desires that you should provide him the necessary assistance to locate the fault.
(A) Although the strike of transporters continues, I shall come.
(B) I shall come if the strikes of transporters continues.
(C) Even though I come, the strike of transporters is going to continue.
Solution
Sentence A: The strike is ongoing, and despite this, the speaker will come. The speaker’s decision to come is definite and not conditional on the strike ending.
Sentence B: The speaker will come only if the strike continues. This is a conditional statement: if the strike stops, the speaker will not come.
Sentence C: Regardless of whether the speaker comes, the strike will continue.
As we can see all three sentences carry a different core message.
Therefore, Option D is the correct answer.
(A) Should you need a visa, you must submit an application along with your passport and a copy of income tax returns.
(B) Unless you do not submit an application along with your passport and a copy of income tax return, you will not get visa.
(C) If you submit your application along with your passport and a copy of income tax returns, you do not need visa.
(A) The judge remarked that not all the accused were really guilty.
(B) The judge remarked that some of the accused were guilty while others were not.
(C) The judge remarked that all those who were accused included some who were not really guilty.=
In each of these questions, four words are given of which two words are most nearly the same or opposite in meaning. Find the two words which are most nearly the same or opposite in meaning and mark the number of the correct letter combination as your answer.
(A) Affected (B) Desolate (C) Anxious (D) Lonely
(A) Disruption (B) Largesse (C) Affection (D) Meanness
(A) Awful (B) Envious (C) Pleasant (D) Fair
(A) Serene (B) Jealous (C) Identical (D) Calm
In each of these questions, you are given a sentence a part of which is underlined. This is followed by four ways of phrasing the underlined part. Select the version that best rephrases the underlined part.
Teachers and parents alike should realise that to say a particular child is better than the other is doing a great injustice to both the children.
He sailed for New York on Monday, arriving there on Saturday for the muchawaited inauguration of the new hospital.
After trying to convince him for a long time. I realised that he was one of those people who never listens to reason.
The number of children seeking admission to this college has risen sharply this year, even though it may be only temporarily.
Each of these questions contains a small paragraph. Read the paragraph carefully to complete the sentence given below each.
The consumption of harmful drugs by the people can be prevented not only by banning their sale in the market but also by instructing users about their dangerous effects which they must understand for their safety. Also the drug addicts may be provided with proper medical facilities for their rehabilitation. This will help in scaling down the use of drugs. The passage best supports the statement that consumption of harmful drugs.
The school has always been the most important means of transferring the wealth of tradition from one generation to the next. This applies today in an even higher degree than in former times for, through the modern development of economy, the family as bearer of tradition and education has become weakened. This passage best supports the statement that for transferring the wealth of tradition from one generation to the next
One of the important humanitarian byproducts of technology is the greater dignity and value that it imparts to human labour. In a highly industrialised society, there is no essential difference between Brahmin and Dalit, Muslim and Hindu; they are equally useful and hence equally valuable, for in the industrial society, individual productivity fixes the size of the pay cheque and this fixes social status. The passage best supports the statement that
There is a shift in our economy from a manufacturing to a service orientation. The increase in servicesector will require the managers to work more with people rather than with objects and things from the assembly line. This passage best supports the statement that
In each of these questions, four sentences are given, denoted by (A), (B), (C) and (D). By using all these four sentences, you have to frame a meaningful paragraph. Choose the correct order of the sentences from the four alternatives.
(A) You would be very surprised indeed to find it hot.
(B) Cold, of course.
(C) Any yet that was what I found when I visited North Island, the northern part of New Zealand.
(D) When you go bathing in a river or a pond, do you expect the water to be hot or cold?
Solution
Reading through the sentences, we see that D poses a rhetorical question to which the answer is given in B. Making DB a pair.
Furthermore, A presents the author's experience, which contradicts the answer (and the norm) he has just given.
And then the author shares where this unique experience was from in C.
Making DBAC a coherent paragraph.
Therefore, Option D is the correct answer.
(A) Because, if the manager's subordinates are inefficient and ineffective and are not helped to increase their efficiency and effectiveness, the task may not be achieved.3
(B) This must be just as true as the responsibility for achieving his prescribed tasks.
(C) If it is achieved, it is at too great a cost, or at the risk of other effects, many of which are less obvious.
(D) It is often said that one of the prime responsibilities of a manager is the training and
development of his staff.
(A) Modern research, however, has proved that there were invaders even before the Aryans poured into this land.
(B) It was thought that they came to a country which was uncivilised and barbarian.
(C) They had evolved a civilisation higher than that of the Aryans hordes who came in their wake.
(D) Till recently the Aryans were regarded as the earliest invaders of the land.
(A) Organisations today are becoming increasingly populated by youthful, highlyskilled, highlyeducated workers.
(B) Two of the most prevalant and provocative organisational dynamics of our time are the themes of participation and change.
(C) These demands for participation are creating pressures for internal organizational change which are matched only by external environmental pressures for organizational change.
(D) These young, skilled and educated workers bring with them demands for a voice in the determination of their own organisational destiny - a chance to participate in those decisions which affect their organisational lives.
For the following questions answer them individually
There are 4 candidates for the post of a lecturer in Mathematics and one is to be selected by votes of 5 men. The number of ways in which the votes can be given is
Solution
Each men can vote for any of the 4 candidates i.e number of ways each men can vote is '4'.
Total number of ways = 4 x 4 x 4 x 4 x 4 = 1024.
Hence, option C is the correct answer.
The number of ways in which 6 men and 5 women can dine at a round table if no two women are to sit together is given by
Solution
As no two women sit together,
6 men are arranged alternately around the table as shown

These 6 men can be arranged in (6 - 1)! ways (or) 5! ways.
Now, 5 women are arranged in remaining 6 places in $$6_{P_{5}}$$ ways (or) 6! ways.
$$\therefore$$ Total number of ways = 6! × 5!
Hence, option A is the correct answer.
A student is to answer 10 out of 13 questions in an examination such that he must choose at least 4 from the first five questions. The number of choices available to him is
Solution
Given, at least 4 questions are to be solved from the first 5 questions. Hence, there are two conditions where he chooses 4 questions from
the first 5 (or) all 5 questions from the first 5.
(1) If he chooses to write 4 questions from the first 5 and 6 questions from remaining 8,
Then number of ways = $$5_{C_{4}}$$ x $$8_{C_{6}}$$ = 5 x 28 = 140.
(2) If he chooses to write 5 questions from the first 5 and 5 questions from the remaining 8,
Then number of ways = $$5_{C_{5}}$$ x $$8_{C_{5}}$$ = 1 x 56 = 56.
$$\therefore$$ Total number of ways = 140 + 56 =196.
Hence, option C is the correct answer.
A club consists of members whose ages are in AP, the common difference being 3 months. If the youngest member of the club is just 7 years old and the sum of the ages of all the members is 250 years, then the number of members in the club are
Solution
For arithmetic progression,
S(n) = $$\frac{n}{2}[2a + (n - 1)d]$$
Given, S(n) = 250 years; d = 3 months (or) 0.25 years; a = 7 years
Substitute the values in the above formula,
$$250 = \frac{n}{2}[2(7) + (n - 1)0.25]$$
$$500 = 14n + 0.25 n^{2} - 0.25n$$
$$ 0.25 ^{2} + 13.75 n - 500 = 0$$
After solving, we get the roots as '-80' and '25'.
we will consider only '25' as '-80' is an imaginary value.
Hence, option C is the correct answer.
A metal cube of edge 12 cm is melted and formed into three smaller cubes. If the edges of two smaller cubes are 6 cm and 8 cm, then find the edge of the third smaller cube.
Solution
Edge of the cube before melting = $$12\ cm$$
Volume of this cube $$(V)= 12^{3} = 1728\ cm$$
Volume of two smaller cubes will be $$6^{3}$$ and $$8^{3}$$ respectively i.e
Volume of first smaller cube $$(V1) = 216\ cm$$;
Volume of second smaller cube $$(V2)= 512\ cm$$
As the bigger cube is melted into three smaller cubes. The volume of the bigger cube is equal to volume of the smaller cubes taken together.
$$V = V1 + V2 + V3$$
$$1728 = 216 + 512 + V3\ (or)\ V3 = 1000$$
Now edge of the third smaller cube = $$\sqrt[3]{1000} = 10$$.
Hence, option A is the correct answer.
A well 22.5m deep and of diameter 7m has to be dug out. Find the cost of plastering its inner curved surface at Rs 3 per sq metre.
Solution
Given,
Height (h) = 22.5, Diameter(d) = 7m and radius(r) = 3.5m
Curved surface area of a cylinder = 2 $$\pi$$ r h ..........(1)
By substituting the above values in equation (1) we get,
$$\Rightarrow$$ 2 x $$\frac{22}{7}$$ x 3.5 x 22.5
$$\Rightarrow$$ 2 x 22 x 0.5 x 22.5 = 495
Curved surface area of the well = 495 m$$^{2}$$
Now, cost of plastering its inner curved surface at 3 per sq meter = 495 x 3 = 1485 rs
Hence, option B is the correct answer.
Water flows out through a circular pipe whose internal diameter is 2 cm, at the rate of 6 metres per second into a cyclindrical tank, the radius of whose base is 60 cm. By how much will the level of water rise in 30 minutes?
Solution
Rate of flow of water in in the pipe = $$\pi r^{2} h_{1}$$
Where, r = 1 cm, h = 6 m (or) 600 cm
$$\therefore$$ Rate of flow of water in the pipe = 600 $$\pi$$ cm$$^{3}$$/second (or) 600 x 60 $$\pi$$ cm$$^{3}$$/minute
And Water after 30 minutes = 600 x 60 x 30 $$\pi$$ cm$$^{3}$$/minute.........(1)
Volume of water in the tank = $$\pi r^{2} h$$
Where, r = 60 cm, h = ?
$$\therefore$$ Volume of water flown in the tank = 3,600 $$\pi$$ h cm$$^{3}$$......(2)
Equate (1) and (2) as the volume of water in the pipe will be equal to volume of water in tank
600 x 60 x 30 $$\pi$$ = 3,600 $$\pi$$ h
h = 300 cm (or) 3 m
Hence, option C is the correct answer.
A ladder 15 m long reaches a window which is 9 m above the ground on one side of a street. Keeping its foot at the same point, the ladder is turned to the other side of the street to reach a window 12 m high. Find the width of the street.
Solution
As per the given question,

Using pythagoras theorem,
$$BC^{2} = AC^{2} - AB^{2}$$
$$BC^{2} = 15^{2} - 12^{2} = 225 - 144 = 81$$
$$BC = 9\ m $$
$$CD^{2} = EC^{2} - ED^{2}$$
$$CD^{2} = 15^{2} - 9^{2} = 225 - 81 = 144$$
$$CD = 12\ m $$
Width of the street = $$12 + 9 = 21\ m$$
Hence, option B is the correct answer.
The horizontal distance between two trees of different heights is 60 m. The angle of depression of the top of the first tree when seen from the top of the second tree is 45°. If the height of the second tree is 80 m, then find the height of the first tree.
Solution
As per the given question,

Let, 'EC' be the first tree and 'AB' be the second tree.
Height of first tree is '$$80\ m$$' and let height of second tree be '$$x$$'
Then, $$AB = x$$ and $$ED = (80 - x)$$
In $$\triangle EAD$$,
tan $$45^{\circ} = \frac{ED}{AD}$$
$$1 = \frac{80-x}{60}$$
$$x = 20\ m$$
Hence, option A is the correct answer.
The number of ways in which a committee of 3 ladies and 4 gentlemen can be appointed from a meeting consisting of 8 ladies and 7 gentlemen, if Mrs X refuses to serve in a committee of which Mr Y is its member, is
Solution
There are two conditions here,
(i) If Mr Y is in the committee then Mrs X will not be selected (or)
(ii) If Mr Y is not selected in the committee then Mrs X will be selected
$$\therefore$$ Total number of ways = $$8_{C_{3}} \times 6_{C_{4}} + 7_{C_{3}}\times 7_{C_{4}}$$
$$\Rightarrow$$ 56 x 15 + 35 x 35 = 2065
Hence, option D is the correct answer.
An aeroplane flying at a height of 300 metres above the ground passes vertically above another plane at an instant when the angles of elevation of the two planes from the same point on the ground are 60° and 45°, respectively. Then the height of the lower plane from the ground, in metres, is
Solution
As per the given question,

Let, the height of first plane be 'AC' which is equal to 300m. Height of second plane be 'BC'.
From triangle ACD,
tan 60$$^{\circ} = \frac{300}{CD}$$
$$\sqrt{3} = \frac{300}{CD}$$
CD = $$\frac{300}{\sqrt{3}}$$......(1)
From triangle BCD,
tan 45$$^{\circ} = \frac{BC}{CD}$$
CD = BC ...........(2)
From equations (1) and (2)
BC = $$\frac{300}{\sqrt{3}}$$
BC = 100$$\sqrt{3}$$
Hence, option A is the correct answer.
A person standing on the bank of a river observes that the angle of elevation of the top of a tree on the opposite bank of the river is 60° and when he retires 40 metres away from the tree, the angle of elevation becomes 30°. The breadth of the river is
Solution
As per the given question,

Let C be the point where the man is and D be the point when retires 40m. Let AB be the length of the tree.
We need to find the breadth of river that is 'BC'
From triangle ABD,
Tan 30$$^{\circ}$$ = $$\frac{AB}{40 + x}$$
$$\frac{1}{\sqrt{3}} = \frac{AB}{40 + x}$$
AB = $$\frac{40 + x}{\sqrt{3}}$$ ......(1)
From triangle ABC,
Tan 60$$^{\circ} = \frac{AB}{x}$$
$$\sqrt{3} = \frac{AB}{x}$$
AB = $$\sqrt{3}x$$ ..................(2)
From equations (1) and (2)
$$\frac{40 + x}{\sqrt{3}}$$ = $$\sqrt{3}x$$
40 + x = 3x
x = 20 m
Hence, option B is the correct answer.
A room has 3 lamps. From a collection of 10 light bulbs of which 6 are not good, a person selects 3 at random and puts them in a socket. The probability that he will have light is
Solution
The probability of picking up a defective lamp in the first attempt = $$\frac{6}{10}$$
The probability of picking up a defective lamp in the second attempt = $$\frac{5}{9}$$
The probability of picking up a defective lamp in the second attempt = $$\frac{4}{8}$$
The probability that he will have light = 1 - {$$\frac{6}{10} \times \frac{5}{9} \times \frac{4}{8}$$}
$$\Rightarrow$$ 1 - $$\frac{120}{720}$$ = 1 - $$\frac{1}{6}$$ = $$\frac{5}{6}$$
Hence, option A is the correct answer.
Out of 13 applicants for a job, there are 5 women and 8 men. It is desired to select 2 persons for the job. The probability that atleast one of the selected persons will be a woman is
Solution
Two persons are to be selected from 5 women and 8 men for the job
The probability that no women is selected = $$\frac{8}{13}$$ and
The probability that atleast one person is women = 1 - $$\frac{8}{13}$$ = $$\frac{5}{13}$$
Hence, option B is the correct answer.
The probability that a certain electronic component fails when first used is 0.10. If it does not fail immediately, then the probability that it lasts for one year is 0.99. The probability that a new component will last for one year is
Solution
The probability that the component fails when used for the first time = 0.1 (or)
The probability that the component does not fail when used for the first time = 1 - 0.1 = 0.9
The probability that the component lasts for one year = 0.99
Hence, the probability that the component will last for one year = 0.9 x 0.99 = 0.891
Hence, option A is the correct answer.
A circular grassy plot of land, 42 m in diameter, has a path 3.5 m wide running around it outside. The cost of gravelling the path at Rs 4 per square metre is
Solution
As per the given question,

The area of the outer path = Area of outer circle - Area of inner circle
$$\Rightarrow \pi r_{1}^{2} - \pi r_{2}^{2}$$
$$\Rightarrow \pi (24.5^{2} - 21^{2})$$
$$\Rightarrow \frac{22}{7} (600.25 - 441)$$
$$\Rightarrow \frac{22}{7} (159.25) = 500.5$$
The cost of gravelling the path at Rs 4 per square metre = $$500.5 \times 4 = 2002$$
Hence, option C is the correct answer.
A plot of land in the form of a rectangle has a dimension 240 m × 180 m. A drainlet 10m wide is dug all around it (outside) and the earth dug out is evenly spread over the plot, increasing its surface level by 25 cm. The depth of the drainlet is
Solution
Volume of the plot = 240 m x 180 m x 0.25 m = 10800 m$$^{3}$$
($$\because$$ The earth dug out is evenly spread over the plot, increasing its surface level by 25 cm)
Total volume of the drainlet is given by,
= (2 x 260 x 10 x h) + (2 x 180 x 10 x h) m$$^{3}$$
Volume of the plot is equal to the volume of the drainlet,
10800 m$$^{3}$$ = (2 x 260 x 10 x h) + (2 x 180 x 10 x h) m$$^{3}$$
10800 = h(5200 + 3600)
10800 = h(8800)
h = 1.227
Hence, option C is the correct answer.
A rectangular tank is 225 m by 162 m at the base. With what speed must water flow into it through an aperture 60 cm by 45 cm that the level may be raised 20 cm in 5 hours?
Solution
Given, Length of the rectangular tank = 225 m
Breadth of the rectangular tank = 162 m
height of rectangular tank = 0.2 m
Volume of the water to be filled in tank = 225 x 162 x 0.2 = 7290 m$$^{3}$$
Speed of the flowing water in the aperture per hour is given by,
= $$\frac{7290}{5 \times (60/100) \times (45/100)}$$
= $$\frac{7290 \times 100 \times 100}{5 \times 60 \times 45}$$
= $$\frac{72900000}{13500}$$
= $$5400$$m/hr
Hence, option B is the correct answer.
An iron pipe 20 cm long has exterior diameter equal to 25 cm. If the thickness of the pipe is 1 cm, then the whole surface of the pipe is
Solution
Given,
The length of iron pipe (h) = 20 cm
External diameter = 25 cm, then external radius will be (R) = 12.5 cm
Internal diameter = 25 - (2) = 23 cm (as thickness of the pipe is 1cm), then internal radius will be (r) = 11.5cm
Total surface area of the pipe = External curved surface area + Internal curved surface area + 2 (Base area)
$$\Rightarrow$$ 2$$\pi$$Rh + 2$$\pi$$rh + 2$$\pi$$(R$$^{2}$$ - r$$^{2}$$)
$$\Rightarrow$$ 2$$\pi$$h(R + r) + 2$$\pi$$(R$$^{2}$$ - r$$^{2}$$)
$$\Rightarrow$$ 2($$\frac{22}{7}$$)(20)(24) + 2($$\frac{22}{7}$$)(24)
$$\Rightarrow \frac{44 \times 24 \times 21}{7}$$ = 3168 cm$$^{2}$$
Hence, option C is the correct answer.
At a point on level ground, the angle of elevation of a vertical tower is found to be such that its tangent is 5/12. On walking 192 metres towards the tower, the tangent of the angle of elevation is 3/4. The height of the tower is
Solution
According to the question,

Let 'h' be the height of the vertical tower. And
$$\angle$$ADC = P, $$\angle$$ACB = Q, CB = $$x$$
In triangle ABC,
tan Q = $$\frac{AB}{BC}$$
$$\frac{3}{4} = \frac{h}{x}$$
$$x = \frac{4h}{3}$$................(1)
In triangle ABD,
tan P = $$\frac{h}{192 + x}$$
$$\frac{5}{12} = \frac{h}{192 + (4h/3)}$$
$$\frac{5}{12} = \frac{3h}{576 + 4h}$$
$$5(576 + 4h) = 36h$$
$$16h = 2880$$ (or) $$h = 180 $$m
Hence, option B is the correct answer.
A man on the top of a vertical tower observes a car moving at a uniform speed coming directly towards it. If it takes 12 minutes for the angle of depression to change from 30° to 45°, then how soon, after this, will the car reach the tower?
Solution
As per the given question,

Given, time taken for the angle of depression to change from $$30^{\circ}$$ to $$40^{\circ}$$ is 12 minutes, so BC = 12s and CD = st
where, s = speed and t = time
In triangle ABC,
tan 45$$^{\circ} = \frac{AB}{12s}$$ (or) AB = st
In triangle ABD,
tan 30$$^{\circ} = \frac{AB}{BD}$$
$$\frac{1}{\sqrt{3}} = \frac{AB}{s(12 + t)}$$
$$\frac{1}{\sqrt{3}} = \frac{st}{s(12 + t)}$$ ($$\because$$ AB = st)
$$12 + t - \sqrt{3}t = 0$$ (or) $$ 12 - 0.73t = 0$$ (or) t = 16.23 (Approx)
Hence, option B is the correct answer.
A school has 4 sections of Chemistry in Class X having 40, 35, 45 and 42 students. The mean marks obtained in Chemistry test are 50, 60, 55 and 45 respectively for the 4 sections. Determine the overall average of marks per student.
Solution
Total marks obtained by all the students in 1st section = 40 x 50 = 2000.
Total marks obtained by all the students in 2nd section = 35 x 60 = 2100.
Total marks obtained by all students in 3rd section = 45 x 55 = 2475.
Total marks obtained by all students in 4th section = 42 x 45 = 1890.
Overall average of marks per student = Total marks of students of all sections/ Total number of students of all sections
$$\Rightarrow$$ (2000 + 2100 + 2475 + 1890)/ (162) = 8465/162 = 52.25
Hence, option B is the correct answer.
The average score of boys in an examination of a school is 71 and that of girls is 73. The average score of the school in that examination is 71.8. Find the ratio of the number of boys to the number of girls that appeared in the examination.
Solution
This problem can be solved easily by allegation method.

Ratio of boys to girls,
$$\Rightarrow$$ 1.2 : 0.8 = 3:2
Hence, option C is the correct answer.
Company C sells a line of 25 products with an average retail price of Rs 1,200. If none of these products sells for less than Rs 420 and exactly 10 of the products sell for less than Rs 1,000, then what is the greatest possible selling price of the most expensive product?
Solution
To calculate the maximum possible price of an item, take price of other items as minimum as possible.
Given that exactly 10 products sells for less than 1000 and no product should be less than 420.
So take the price of 10 items as 420 rs each (minimum possible price)
$$\therefore$$ Price of these 10 items will be 420 x 10 = 4200.
Now, remaining 14 items (except the high priced item) should be 1000 rs each (minimum possible price)
$$\therefore$$ Price of these 14 items will be 14 x 1000 = 14,000
And price of 24 items = 4,200 + 14,000 = 18,200 .....(1)
Given average retail price of 25 products = 1,200 (or) Total price of all items = 25 x 1,200 = 30,000
Now, the greatest possible price of the most expensive product is given by,
Total price of all items - minimum possible price of 24 items (i.e equation (1))
$$\Rightarrow$$ 30,000 - 18,200 = 11,800
Hence, option D is the correct answer.
A sink contains exactly 12 litres of water. If water is drained from the sink until it holds exactly 6 litres of water less than the quantity drained away, then how many litres of water were drained away?
Solution
Let, the amount of water drained be 'x'
Then total amount of water left in sink = x - 6
$$\therefore$$ x + x - 6 = 12
2x - 6 = 12 (or) x = 9L
Hence, option D is the correct answer.
A chemist has 10 litres of a solution that is 10 per cent nitric acid by volume. He wants to dilute the solution to 4 per cent strength by adding water. How many litres of water must he add?
Solution
The chemist has 10 litres of solution of which 10% is nitric acid i.e remaining 90% is water.
Now he wants to dilute it to 4% from 10% by adding water.
Let x be the total water added. Then 4% of nitric acid should become 4% of total solution after adding 'x' litres of water.
Now equation can be written as,
1L = 4 % of (10 + x)
25 = 10 + x (or) x = 15L
Hence, option A is the correct answer.
A company received two shipments of ball bearings. In the first shipment, 1 per cent of the ball bearings were defective. In the second shipment, which was twice as large as the first, 4.5 percent of the ball bearings were defective. If the company received a total of 100 defective ball bearings, then how many ball bearings were there in the first shipment?
Solution
Let, 'x' and '2x' be the number of goods in first shipment and second shipment respectively.
Defective pieces in 1st shipment is '1%' and 2nd shipment is 4.5%
Total defective pieces is 100 i.e
1% of x + 4.5% of x = 100
10% of x = 100 (or) x = 1000.
Total ball bearings in the first bearing = 1000
Hence, option C is the correct answer.
In a certain laboratory, chemicals are identified by a colour coding system. There are 20 different chemicals. Each one is coded with either a single colour or a unique two colour pair. If the order of colours in the pair doesn't matter, then what is the minimum number of different colours needed to code all the 20 chemicals with either a single colour or a unique pair of colours?
Population of a district is 2,96,000 of which 1,66,000 are males. 50% of the population is literate. If 70% males are literate, then the number of women who are literate, is
Solution
Given,
Total population of the district = 2,96,000
Total number of males = 1,66,000 and females = 1,30,000
Total number of literates = 50 % of 2,96,000 = 1,48,000
70% of males are literates i.e 0.07 x 1,66,000 = 1,16,000 are literates
Now, total number of literate woman are,
(Total number of literates) - ( Total number of male literates)
$$\Rightarrow$$ 1,48,000 - 1,16,000 = 31,800.
Hence, option B is the correct answer.
A train covers 180 km distance in 4 hours. Another train covers the same distance in 1 hour less. What is the difference in the distances covered by these trains in one hour?
Solution
Speed of first train = 180/4 = 45 kmph.
Speed of second train = 180/3 = 60 kmph.
First train covers 45 km in 1 hour and second train covers 60 km in 1 hour.
Difference between them = (60 - 45)km = 15km.
Hence, option D is the correct answer.
Speed of a speedboat when moving in the direction perpendicular to the direction of the current is 16 km/hr. Speed of the current is 3 km per hour. So the speed of the boat against the current will be (in km/hr)
Solution
Given, speed of the boat when moving perpendicular to the direction of current = 16 km/hr and speed of current = 3 km/hr
Speed of the boat in still water = 16 - 3 = 13 km/hr
Speed of the boat against current = 13 - 3 = 10 km/hr
Hence, option C is the correct answer.
R and S start walking towards each other at 10 AM at the speeds of 3 km per hour and 4 km per hour respectively. They were initially 17.5 km apart. At what time do they meet?
Solution
Given, R and S are moving at the speeds of 3 kmph and 4 kmph respectively. And distance between them is 17.5 km
Relative speed = 3 + 4 = 7 kmph
Time taken for R and S to meet = $$\frac{17.5}{7}$$ = $$2.5$$ hours
They meet at (10 AM + 2.5 hours) = 12:30 PM
Hence, option D is the correct answer.
A shopkeeper marks up his goods to gain 35%. But he allows 10% discount for cash payment. His profit on the cash transaction therefore, in percentage, is
Solution
Let, cost price of the goods be 100x
As the shopkeeper marks up by 35% and gives 10% discount for cash transactions,
S.P = 90% of 135% of 100x
$$\Rightarrow$$ 0.09 $$\times$$ 1.35 $$\times$$ 100x
$$\Rightarrow$$ 121.5x i.e profit percentage = 21.5%
Hence, option C is the correct answer.
A can do 50% more work as B can do in the same time. B alone can do a piece of work in 20 hours. A, with help of B, can finish the same work in how many hours?
Solution
Work done by B in hour is given by $$\frac{1}{20}$$
As A can do 50% more efficient than B,
$$\frac{1}{A} = 150 % of \frac{1}{B}$$
$$\frac{1}{A} = \frac{3}{2} \times \frac{1}{B}$$
$$\frac{1}{A} = \frac{3}{2} \times \frac{1}{20}$$
$$A = \frac{3}{40}$$
Work done by A and B together in hour = $$\frac{1}{A} + \frac{1}{B}$$
$$\Rightarrow \frac{3}{40} + \frac{1}{20}$$
$$\Rightarrow \frac{3 + 2}{40} = \frac{1}{8}$$
Total work done by A and B together = 8 hours.
Hence, option B is the correct answer.
Profits of a business are distributed among three partners A, B and C in such a way that 4 times the amount received by A is equal to 6 times the amount received by B and 11 times the amount received by C. The ratio in which the three received the amount is
Solution
Given that 4 times the amount received by A is equal to 6 times the amount received by B and 11 times the amount received by C.
This can be written as,
4A = 6B or A : B = 3 : 2 ....(1) and
4A = 11C or A : C = 11 : 4 ....(2)
Multiply equation (1) with 11 and equation (2) with 3 we get,
A :B = 33 : 22 and A : C = 33 : 12 (or)
A : B : C = 33 : 22 : 12 (or) 66 : 44 : 24
Hence, option D is the correct answer.
A train covered a certain distance at a uniform speed. If the train had been 6 km/hr faster, then it would have taken 4 hours less than the scheduled time. And, if the train were slower by 6 km/hr, then the train would have taken 6 hours more than the scheduled time. The length of the journey is
Solution
Let the actual distance travelled by train be 'd'. Similarly, actual speed and time be 's' and 't'
Given, If the train had been 6 km/hr faster, then it would have taken 4 hours less than the scheduled time,
st = (6 + s)(t - 4) (or) 6t - 4s -24 = 0................(1)
If the train were slower by 6 km/hr, then the train would have taken 6 hours more than the scheduled time,
st = (s - 6)(t + 6) (or) 6t - 6s + 36 = 0...............(2)
Subtract equation (1) and (2)
2s = 60 (or) s = 30
Substitute the value of 's' in equation (1)
6t - 4(30) = 24 (or) 6t = 144 (or) t = 24
The length of the journey (or) total distance = 24 x 30 = 720
Hence, option C is the correct answer.
Students of a class are made to stand in rows. If 4 students are extra in each row, then there would be 2 rows less. If 4 students are less in each row, then there would be 4 more rows. The number of students in the class is
Solution
Let, the number of rows = 'x' and the number of students in the row be 'y'
Given that, if 4 students are extra in each row, then there would be 2 rows less,
(x - 2)(y + 4) = xy
xy + 4x -2y -8 = xy (or) 4x - 2y = 8 ...........(1)
If 4 students are less in each row, then there would be 4 more rows,
(x + 4)(y - 4) = xy
xy - 4x + 4y - 16 = xy (or) 4x - 4y = -16 .......(2)
Subtract equations (1) and (2)
2y = 24 (or) y =12
Substitute value of 'y' in equation (1)
4x - 2(12) = 8 $$\Rightarrow$$ 4x = 8 + 24 $$\Rightarrow$$ x = 8
Number of students in the class = xy $$\Rightarrow$$ 8 x 12 = 96
Hence, option D is the correct answer.
A part of monthly expenses of a family is constant and the remaining varies with the price of wheat. When the rate of wheat is Rs 250 a quintal, the total monthly expenses of the family are Rs 1000 and when it is Rs 240 a quintal, the total monthly expenses are Rs 980. Find the total monthly expenses of the family when the cost of wheat is Rs 350 a quintal.
Solution
Let, the part of monthly expenses which is constant be 'x' and
The part which varies with the price of wheat be 'y'
Then according to the question,
x + 250y = 1000 ......(1)
x + 240y = 980 ........(2)
Subtract equations (1) and (2)
250y - 240y = 1000 - 980
10y = 20 $$\Rightarrow$$ y = 2
Substitute value of 'y' in equation (1)
x + 250(2) = 1000 $$\Rightarrow$$ x = 500
The total monthly expenses of the family when the cost of wheat is Rs 350 a quintal is,
500 + 350(2) = 1200
Hence, option C is the correct answer.
A plane left 30 minutes later than the scheduled time and in order to reach the destination 1500 km away in time, it had to increase the speed by 250 km/hr from the usual speed. Find its usual speed.
Solution
Let usual speed of the plane be 's' km/hr and new speed be 'x + 250' km/hr
As the plane left 30 minutes late, the difference between this time and usual time will be equal to 30 minutes.
$$\frac{1500}{s} - \frac{1500}{x + 250} = \frac{30}{60}$$
$$\frac{1500s + 1500 \times 250 - 1500s}{s(s + 250)} = \frac{1}{2}$$
$$1500(s + 250 - s) \times 2 = s(s+250)$$
$$75000 = s^{2} + 250s$$
$$s^{2} + 250s - 7,50,000 = 0$$
Roots for the above equation are $$750$$ and '$$-1000$$'
As '$$-1000$$' is a negative value, consider only $$750$$.
Hence, option D is the correct answer.
A metallic sheet is of rectangular shape with dimensions 48 cm × 36 cm. From each one of its corners, a square of 8 cm is cut off. An open box is made of the remaining sheet. Find the volume of the box.
Solution
Length of the box after the sheet is cut off (l) = 48 - (8 + 8) = 32 cm
Breadth of the box after the sheet is cut off (b) = 36 - (8 + 8) = 20 cm
Height (h) = 8 cm
Volume of the box = l x b x h
$$\Rightarrow$$ 32 x 20 x 8 = 5120 cm$$^{3}$$
Hence, option C is the correct answer.
In each of these problems, two statements containing certain data follow a question. Determine whether the data provided by the statements are sufficient to answer the given question. Choose the correct answer based upon the statements’ data, your knowledge of mathematics, and your familiarity with everyday facts.
Mark your answer as:
1) if statement (A) by itself is sufficient to answer the given question, but statement (B) by itself is not;Answer
2) if statements (A) and (B) taken together are sufficient to answer the given question, even though neither statement by itself is sufficient;Answer
3) if statement (B) by itself is sufficient to answer the given question, but statement (A) by itself is not;Answer
4) if either statement by itself is sufficient to answer the given question
Does rectangle A have a greater perimeter than rectangle B?
i. The length of a side of rectangle A is twice the length of a side of rectangle B.
ii. The area of rectangle A is twice the area of rectangle B.
If there is an average of 250 words on each page, then how many pages can Michael read in an hour?
1) There is an average of 25 ten-word lines on each page.
2) Michael can read 30 ten-word lines per minute.
If he did not stop along the way, then what speed did Bill average on his 3hour trip?
1) He travelled a total of 120 miles.
2) He travelled half the distance at 30 miles per hour and half the distance at 60 miles per hour
On a certain construction crew, there are 3 carpenters for every 2 painters. What per cent of the entire crew are carpenters or painters?
A. Eighteen per cent of the crew are carpenters.
B. Twelve per cent of the crew are painters.
Are at least 30 per cent of the people in City H who are 30 years old or older bilingual?
A. In City H, 30 per cent of the population is at least 30 years old.
B. In City H, of the population 30 years old or older, 18 per cent of the women and 17 per cent
of the men are bilingual.
DIRECTION : A professor keeps data on students tabulated by performance and sex of the student. The data is kept on a computer disk, but unfortunately some of it is lost because of a virus. Only the following could be recovered:
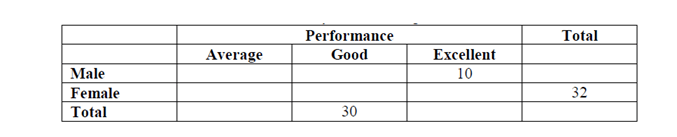
Panic buttons were pressed but to no avail. An expert committee was formed, which decided that the following facts were self evident:
1.One third of the male students were average.
2.Half the students were either excellent or good.
3.40% of the students were females.
Which is the fuel whose proportion in the total energy demand will increase continuously over the period 2005-2020 in Asia?
Which is the fuel whose proportion in the total energy demand will remain unaltered from 2005 to 2010 in Asia?
For which source of energy is the demand in 2020 as a ratio of demand in 2005 in the Asian region the greatest?
Which is the fuel for which demand in the rest of the world (excluding Asia) as a proportion of total energy demand of the world (including Asia) shows continuous decrease over the period?
Over 2005-2020, which two fuels meet more than 60 per cent of the total energy demand of the World and Asia both?
Study the following line graphs showing the production (in '0000) and percentage exported of scooters, motorbikes and cars respectively over the years.


In which of the following years was the production of cars more than 50% of the total
production?
Find the total number of automobiles exported in the year 1999.
Find the ratio of cars, scooters and motorbikes exported in 1996.
If the ratio of export prices of a car, scooter and motorbike was 2 : 1 : 1.5 in 1998, then what was the proportion of their export earnings?
In which of the following years was the production of motorbikes exactly 40% of the total production of automobiles in that year?
A survey was conducted in five cities, viz Pune, Kanpur, Raisen, Surat and Trivandrum; for the percentage of people using T (trains), B (buses), C (cars); as modes of transport. The number of persons surveyed in the cities; Pune, Kanpur, Raisen, Surat and Trivandrum are 2000, 4000, 6000, 3000 and 8000 respectively. Refer to the data in the following triangular bar diagram to answer these questions.
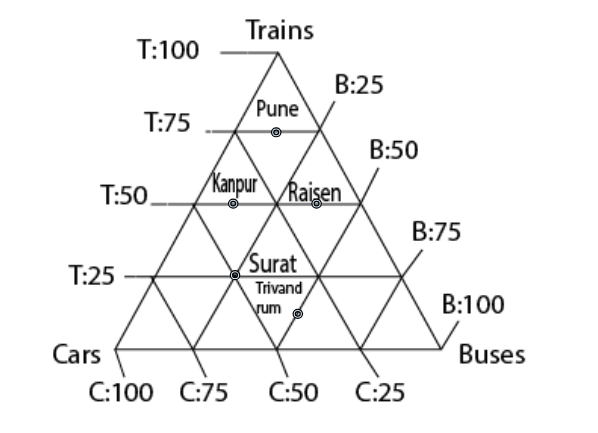
The city where the least number of persons use buses is
Solution
We can convert the chart into the following table:

Users of bus:
Pune = 2000*.125 = 250
Kanpur = 4000*.125 = 500
Raisen = 6000*.375 = 2250
Surat = 3000*.25 = 750
Trivandrum = 8000*.5 = 4000
The average number of persons using trains for transportation in Pune, Kanpur, Raisen, and Trivandrum is
Solution
We can convert the chart into the following table:
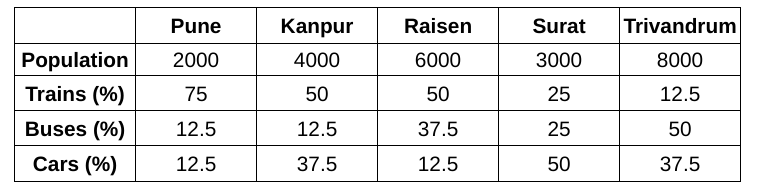
Users of train :
Pune = 2000*.75 = 1500
Kanpur = 4000*.50 = 2000
Raisen = 6000*.5 = 3000
Surat = 3000*.25 = 750
Trivandrum = 8000*.125 = 1000
Average = 1875
The mode of transport used by the least number of persons in all the given cities is
Solution
We can convert the chart into the following table:
Users of bus:
Pune = 2000*.125 = 250
Kanpur = 4000*.125 = 500
Raisen = 6000*.375 = 2250
Surat = 3000*.25 = 750
Trivandrum = 8000*.5 = 4000
Total bus users: 7750
Users of train :
Pune = 2000*.75 = 1500
Kanpur = 4000*.50 = 2000
Raisen = 6000*.5 = 3000
Surat = 3000*.25 = 750
Trivandrum = 8000*.125 = 1000
Total Train users: 8250
Remaining users = Users of Cars = 7000
Among the given five cities, the cities where less than 30% of the people use cars for transport are
Solution
We can convert the chart into the following table:
Cities with less than 30% of the population uses cars = Pune and Raisen
Which of the following statements is not true?
Solution
We can convert the chart into the following table:
Clearly, we can see there is 37.5% people in Trivandrum uses car and not 50%.
Direction for the questions: Study the following graph and pie chart carefully to answer the questions given below:

If the total number of valid votes in 2002 Gujarat elections was 5 crore, then find the average number of votes for winning one seat for other political parties.
In which of the following years was the number of seats won by BJP maximum with respect to the previous given year?
In 1998, if 2.24 crore votes were valid for BJP, whereas in 1990 there were 1.228 crore votes valid for Congress, then by what per cent was the number of valid votes less in 1990 with respect to that in 1998?
In which of the following years did the BJP secure more than 66(2/c:% of the total seats?
In which of the following years, was the difference in the number of valid votes for any two political parties the maximum?
Study the following graphs showing the number of workers of different categories of a factory for two different years. The total number of workers in 1998 was 2000 and in 2000 was 2400.
1998

2000

In which of the categories is the number of workers same in both the years?
Find the percentage increase in the number of workers in category U in 2000.
What is the total number of increased workers for the categories in which the number of workers has been increased?
Which of the following categories have shown decrease in the number of workers from 1998 to 2000?
Find the Maximum difference between the number of workers of any two categories taken together for any one year and that of any two for the other year.
The scatter diagram shows the number of students passing in the high school examination in the given years from the four houses of a Public School.

The average number of students for each house who have passed in the given years is
The performance for which of the following houses is the best?
For which of the following houses is the percentage change in the results maximum for any year over the previous year?
If the trend observed between 1999 and 2000 continues during the next year, then what will be the number of students passing the exam in 2001?
The number of students keeps on increasing by 50 every year. In 1998, there were 250 students. For which of the following years is the performance best in the school?
In each of these questions, there is given a Statement followed by two Assumptions. Consider the Statement and both the Assumptions to decide which of the Assumptions is implict in the Statement.
Give your answer as:
1) if only Assumption X is implicit.Answer:
2) if only Assumption Y is implicit.Answer:
3) if both the Assumptions X and Y are implicit, andAnswer:
4) if neither Assumption X nor Y is implicit.
Statement :
Man is born free.
Assumptions:
X : Freedom is the birth right of man.
Y : All humans have human rights.
Statement:
Laugh and the world will laugh with you.
Assumptions:
X : People generally laugh.
Y : Laughter symbolises happiness.
Statement:
There is no need to open a school here.
Assumptions:
X : Children in this area do not study.
Y : There are already many schools in this area.
Statement:
Owing to stress and fast pace of life, your digestive system is attacked.
Assumptions:
X : There is stress in life.
Y : Digestive system has no defence.
Statement:
Barking dogs seldom bite.
Assumptions:
X : Dogs always bark.
Y : Some dogs bite.
For the following questions answer them individually
An application was received by inward clerk in the afternoon of a week day. Next day, he forwarded it to the table of the senior clerk, who was on leave that day. The senior clerk put up the application to the desk officer next day in the evening. The desk officer studied the application and disposed off the matter on the same day, ie Friday. The application was received by the inward clerk on
In a queue of children, Kashish is fifth from the left and Mona is sixth from the right. When they interchange their places among themselves, Kashish becomes thirteenth from the left. Then, what will be Mona's position from the right?
If the numbers from 1 to 45 which are exactly divisible by 3 are arranged in ascending order, minimum number being on the top, then which number would come at the ninth place from the top?
Which letter should be the ninth letter to the left of the ninth letter from the right, if the first half of the alphabets of English are reversed?
In a family, a couple has a son and a daughter. The age of the father is three times that of his daughter and the age of the son is half of his mother. The wife is 9 years younger to her husband and the brother is seven years older to his sister. What is the age of the mother?
A number of friends decided to go on a picnic and planned to spend Rs 96 on eatables. Four of them did not turn up. As a consequence, each of the remaining ones had to contribute Rs 4 extra. The number of those who attended the picnic was
Solution
Let initially, there were x friends. So each one had to contribute Rs. 96/x
Now, 4 friends didn't show up. so, the remaining x - 4 friends had to pay Rs. 4 extra.
So, the equation will be:$$\dfrac{96}{x-4}-\dfrac{96}{x}=4$$
Now, out of all the options, only x = 12 satisfies the equation. Hence, the number of friends who attended the picnic are 12 - 4 = 8
Out of a total of 120 musicians in a club, 5% can play all the three instruments --- guitar, violin and flute. It so happens that the number of musicians who can play any two and only two of the above instruments is 30. The number of musicians who can play the guitar alone is 40. What is the total number of those who can play violin alone or flute alone?
There are 50 students admitted to a nursery class. Some students can speak only English and some can speak only Hindi. Ten students can speak both English and Hindi. If the number of students who can speak English is 21, then how many students can speak Hindi, how many can speak only Hindi and how many can speak only English?
Solution
Assume the students who can speak only English be "x", both English and Hindi be "y" and only Hindi be "z".
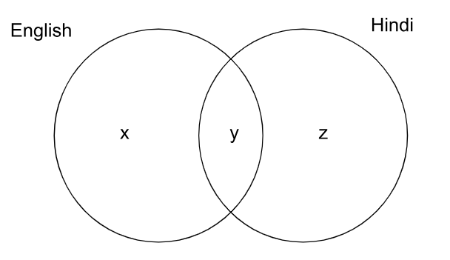
We know x+y+z = 50 . . .(1)
Given y = 10
Also, given the number of students who can speak English is 21, or x+y = 21
So, x+10 = 21
x = 11
Putting in eqn (1) we get
11+10+z = 50
So, z = 29.
Students who can speak Hindi are y+z = 10+29 = 39
Students who can speak only Hindi are z = 29
Students who can speak only English are x = 11
Hence, the answer is Option A.
The letters of the name of a vegetable are I, K, M, N, P, P, U. If the letters are rearranged correctly, then what is the last letter of the word formed?
Solution
When the letters I, K, M, N, P, P, U are rearranged correctly, the name of the vegetable formed is PUMPKIN. Last letter of PUMPKIN is 'N'.
Hence, the correct answer is Option B
At a farm, there are hens, cows and bullocks, and keepers to look after them. There are 69 heads less than legs; the number of cows is double than that of the bullocks; the number of cows and hens is the same and there is one keeper per ten birds and cattle. The total number of hens plus cows and bullocks and their keepers does not exceed 50. How many cows are there?
In each of these questions, there is given a Statement followed by two Assumptions numbered I and II. Consider the Statement and the following Assumptions to decide which of the Assumptions is implicit in the Statement:
Mark your answer asAnswer:
1) If only Assumption I is implicit
2) If either Assumption I or II is implicit
3) If only Assumption II is implicit
4) If neither Assumption I nor II is implicit.
Statement:
Like a mad man, I decided to follow him.
Assumptions:
I. I am not a mad man.
II. I am a mad man.
Statement:
If it is easy to become an engineer, I don't want to be an engineer.
Assumptions:
I. An individual aspires to be professional.
II. One desires to achieve a thing which is hardearned.
Statement:
All the employees are notified that the organisation will provide transport facilities at half the cost from the nearby railway station to the office except those who are being provided with travelling allowance.
Assumptions:
I. Most of the employees will travel by the office transport.
II. Those who are provided with travelling allowance will not read such notice.
Statement:
An advertisement of a Bank, "Want to open a bank account! Just dial our 'room service' and we will come at your doorsteps".
Assumptions:
I. There is a section of people who require such services at their home.
II. Nowadays banking has become very competitive.
Statement:
I can take you quickly from Kanpur to Lucknow by my cab but then you must pay me double the normal charges.
Assumptions:
I. Normally, it will take more time to reach Lucknow from Kanpur.
II. People want to reach quickly but they will not pay extra money for it.
In each of these questions, various terms of a series are given with one term missing as shown by (?). Choose the missing term.
QPO, SRQ, UTS, WVU, (?)
19, 2, 38, 3, 114, 4, (?)
YEB, WFD, UHG, SKI, (?)
AZ, CX, FU, (?)
2Z5, 7Y7, 14X9, 23W11, 34V13, (?)
Read the information given below carefully to answer these Questions. From a group of six boys M, N, O, P, Q, R and five girls G, H, I, J, K; a team of six is to be selected.
Some of the criteria of selection are as follows:
M and J go together.
O cannot be placed with N.
I cannot go with J.
N goes with H.
P and Q have to be together.
K and R go together.
Unless otherwise stated, these criteria are applicable to all the below questions.
If the team consists of two girls and I is one of them, then the other members are
If the team has four boys including O and R, then the members of the team other than O and R are
If four members are boys, then which of the following cannot constitute the team?
If both K and P are members of the team and three boys in all are included in the team, then the members of the team other than K and P are
If the team has three girls including J and K, then the members of the team other than J and K are
These questions are based on the diagram given below showing four persons stationed at the four corners of a square piece of a plot as shown:

A starts crossing the plot diagonally. After walking half the distance, he turns right, walks some distance and turns left. Which direction is A facing now?
From the original position given in the above figure, A and B move one arm length clockwise and then cross over to the corners diagonally opposite; C and D move one arm length anticlockwise and cross over to the corners diagonally opposite. The original configuration ABCD has now changed to
From the original position, B and D move one and a half length of sides clockwise and anticlockwise respectively. Which one of the following statements is true?
From the positions in the original figure, C and A move diagonally to opposite corners and then one side each clockwise and anticlockwise respectively. B and D move two sides each clockwise and anticlockwise respectively. Where is A now?
After the movements given in the above question, who is at the northwest corner?
In each of these questions, a statement is followed by three Courses of Action numbered I, II and III. Assume everything in the statement to be true to decide which of the three given suggested Courses of Action logically follows for pursuing.
Statement :
In one of the worst accidents on a railway level crossing, fifty people died when a bus carrying them collided with a running train.
Courses of Action:
I. The train driver should immediately be suspended.
II. The driver of the bus should be tried in court for negligence on his part.
III. The railway authorities should be asked to man all its level crossings.
Statement:
There was a spurt in criminal activities in the city during the recent festival season.
Courses of Action:
I. The police should immediately investigate into the causes of this increase.
II. In future, the police should take adequate precautions to avoid recurrence of such a situation during festivals.
III. The known criminals should be arrested before any such reason.
Statement:
A mass mortality of shrimps in ponds on entire Andhra coast has recently been reported due to the presence of a virus.
Courses of Action:
I. The water of the ponds affected should immediately be treated for identifying the nature of the virus.
II. The catching of shrimps from the ponds should temporarily be stopped.
III. The fisherman should be asked to watch for the onset of such phenomenon in nature.
Statement:
The weather bureau has through a recent bulletin forecast heavy rainfall during the next week which may cause water logging in several parts of the city.
Courses of Action:
I. The bulletin should be given wide publicity.
II. The civic authority should keep in readiness the pumping system for removal of water from these parts.
III. The people should be advised to stay indoors during the period.
Statement :
The world will have to feed more than 10 billion people in the next century, of whom half will be in Asia and will eat rice as their staple food.
Courses of Action:
I. More funds should immediately be allocated for rice research to help ensure adequate supplies.
II. The people in Asia should be encouraged to change their food habits.
III. The rice should be grown in countries outside Asia to meet the demand.
Read the following passage to examine each inference given against below Questions in the context of this passage.
Mark your answer as:
1)If the inference is 'definitely true'
2)If the 'data provided is inadequate'
3)If the inference is 'probably true'
4)If the inference is 'definitely false'
The space exploration has been done mainly by using unmanned satellites called spaceprobes containing a large variety of latest scientific instruments on board. These space probes have provided us the close-up pictures and other data about planets and other bodies in the outer space. The climax of the intensive American space programme came when Neil Armstrong became the first man to set foot on the moon on July 20, 1969. Originally, the artificial satellites were launched for studying the upper atmosphere of the earth.
The space probes have increased our knowledge about space and the bodies in it.
Space probes are meant to study the upper atmosphere of the earth only.
Neil Armstrong was the first man to go into space.
Space probes are provided with computers.
Moon has been explored by man.
For the following questions answer them individually
Which bank projects itself as "Indian International Bank"?
The tagline "Everyday Solutions" is associated with which company?
"Servo" lubricant is a product from which oil company?
Which of the following companies is the world's largest maker of computer chips?
Which airline is India's largest private sector passenger carrier?
The term CRM stands for
Which of the following is not a private Indian Bank?
Peter Drucker was a famous
Which is the world's single largest manufacturing industry in terms of revenue and employment?
What does SEZ stand for
SIDBI stands for
Which passenger car major has recently decided to locate its plant near Chennai?
Which company has launched the car model Laura?
When did the Central Right to Information Act become effective?
Which country has been facilitating talks between the LTTE and Sri Lankan government to reach peaceful solution of the ethnic in Sri Lanka?
Which of the following bodies certifies the circulation figures of newspapers?
The gas which had leaded out of Union Carbide factory in Bhopal was
India has a
The headquarters of the International Olympic Committee is at
Siachen is a
Match the following:

Who has the Constitutional authority to decide the tax share of States?
Which of the following is the publisher of 'Employment News'?
Panchayati Raj is based on the ideology of
The difference between a bank and a nonbanking financial institution (NBFI) is that
Wimbledon, known for lawn tennis courts, is in
May 8 is observed as
CIS consists of the republics of former
The per capita income is obtained by
Antyodaya programme was chiefly aimed at the upliftment of
The words 'Satyameva Jayate' inscribed below the base plate of the emblem of India are taken from 152.'Agenda21' refers to
'Agenda21'refers to
Which of the following European countries is the first buyer of Maruti cars?
The United Nations Conference on Trade and Development (UNCTAD) is located at which of the following places?
The cause of inflation is
Which organ of the UNO considered as the World Parliament?
Which of the following organisations keeps a check on prices of essential commodities?
Which of the following pairs books and authors is correct?
Where are the headquarters of Oil and Natural Gas Commission located?
The oldest democratic system the world is in

