Determine what day of the week was on 6th July, 2003 if 10th July, 2010 was a Thursday?
IIFT 2022 Slot 1 Question Paper (18th Dec)
For the following questions answer them individually
Solution
It is given that 10th July 2010 was a Thursday.
Let's calculate what day it is on 10th July 2003; from that; we can calculate 6th July 2003.
One year = 365 days = 52 weeks + 1day
Hence, For any given date, the day will change by one place (i.e. Monday to Tuesday,...Wednesday to Thursday,...) for the succeeding year.
One Leap year = 366 days 52 weeks + 2 days.
Hence, If the year is a leap year, then the day will change by two places (i.e. Monday to Wednesday,...Wednesday to Friday,...) for the succeeding year.
We get the following table,

As 10th July 2003 is Tuesday, 6th July 2003 will be Friday.
Option (C) is the answer.
A man invests a certain principal amount of money at 6.5% per annum simple interest and another principal amount of money at 7.5% per annum simple interest. Without reinvestment his income from interest after 3 years is Rs. 400. One fourth of first principal amount is equal to one fifth of the second principal amount. Find the approximate total sum that was invested.
Solution
Let $$'y'$$ be the principal amount invested at a 6.5% per annum rate.
Let $$'x'$$ be the principal amount invested at a 7.5% per annum rate.
It is given that, $$\frac{y}{4}=\frac{x}{5}$$............(1)
It is also given that without reinvestment, his income from interest after 3 years is Rs. 400
i.e., $$y\times\ 3\times\ 0.065+x\times\ 3\times\ 0.075=400$$
$$\frac{4x}{5}\times\ 3\times\ 0.065+x\times\ 3\times\ 0.075=400$$
$$0.381x=400$$
Hence, $$x=Rs.\ 1049.87$$, then $$y=\frac{4x}{5}=\frac{1049.87\times\ 4}{5}=Rs.\ 839.90$$
Total invested sum = $$y+x=$$ = $$1889.77\approx Rs.1890$$
Option (A) is correct.
A clock is set right at 7AM on 12th January, 2022. The clock loses 18 minutes in every 24 hours. What will be the approximate true time when clock indicates 7PM on 17th January 2022?
Solution
Let $$'x'$$ be the true time when the clock indicates 7 PM on 17th January 2022.
Let $$'y'$$ be the number of hours elapsed between 7 AM on 12th January, 2022 and $$'x'$$
The clock loses 18 minutes per 24 hours.
For one hour, it loses$$=\frac{18}{24\ \times \ 60}=\frac{1}{80}\ \ hrs$$
For $$'y'$$ hours it loses = $$\frac{y}{80}\ \ hrs$$
Hence, the number of hours elapsed between 7 AM on 12th January 2022 and 7 PM on 17th January 2022 = $$y-\frac{y}{80}$$
$$y-\frac{y}{80}=5\times\ 24+12$$
$$\frac{79y}{80}=132$$
$$y=133.671\ hrs$$
$$y=24\times\ 5.5+1.67\ hrs$$
Hence, the approximate true time when the clock indicates 7 PM on 17th January 2022 = 7 AM, 12th January 2022 + $$'y' hrs$$
= 7 AM, 12th January 2022 + 5days +12 hrs +1.67 hrs
= 7 PM on 17th January 2022 + 1.67 hrs
= 08:40:15 PM 17th January 2022.
Option (D) is the answer.
Two pipes can fill a tank in 12 hours and 18 hours, respectively. The pipes are opened simultaneously, and it is found that due to leakage at the bottom of the tank, it took 36 minutes more to fill the tank. When the tank is full, in what time the leak will empty it?
Solution
Let the volume of the tank be L.C.M of (12,18) = $$72 m^3$$
The rate of inflow of the pipes are, $$\frac{72}{12}=6\ \frac{m^3}{hr}\ \&\ \frac{72}{18}=4\ \frac{m^3}{hr}$$
Let the rate of leakage be $$x\ \frac{m^3}{hr}$$
The total time it takes for both pipes to fill the tank = $$\frac{72}{6+4}=\frac{72}{10}=7.2\ hr$$
But due to leakage, the pipes took 36 min more to fill the tank, $$\frac{72}{6+4-x}=7.2\ +\frac{36}{60}$$
$$\frac{72}{10-x}=7.8$$
on solving, we get $$x=\frac{10}{13}\ \frac{m^3}{hr}$$
The total time taken by the leak to empty the full tank = $$\frac{72}{\frac{10}{13}}=93.6\ hr$$
A potential recruit get a total of 55% marks. There are 6 performance parameters with maximum marks of 100 in each parameter. The recruit gets marks in the ratio of 10:9:8:7:6:5, respectively, in different parameters. In the first 3 parameters, the criteria for clearing the performance core is 55% of the maximum marks and for the next 3 parameters is 50% of the maximum marks. How many parameters has the recruit cleared?
Solution
The total marks = $$100\times\ 6=600$$
The recruit got 55% of the total marks, i.e. = $$55\%\times\ 600=330$$.
The recruit gets marks in the ratio of 10:9:8:7:6:5 in each parameter.
Let the marks in each parameter be $$10x,\ 9x,\ ...,\ 5x$$.
we have, $$10x+\ 9x+8x+7x+6x+5x=330$$
$$45x=330$$
$$x=\frac{22}{3}$$
Hence, the marks in each parameter are $$73.33,\ 66,\ 58.67,\ 51.33,\ 44,\ 36.67$$
The criteria for clearing the performance score is 55% of the maximum marks for first 3 and for the next 3 parameters is 50% of the maximum marks.
Hence the recruit cleared four parameters. Option (c) is the answer.
The sides of a triangle are 21, 20 and 13 cm. The given triangle is divided into two triangles by the perpendicular on the longest side from the opposite vertex. What is value of 30% area of the smaller triangle formed?
Solution
Let the lengths of BD, CD and AD be $$x,\ y\ \&\ h$$, respectively.

=> $$ BD+CD = x+y=21$$.....(1)
As AD is altitude, using Pythagoras' theorem, we get
$$13^2=x^2+h^2$$ .....(2)
$$20^2=y^2+h^2$$.....(3)
Eq (3) - (2) gives
$$20^2-13^2=y^2-x^2$$
$$231=\left(y-x\right)\ \left(y+x\right)$$
$$\left(y-x\right)=\frac{231}{x+y}=\frac{231}{21}=\ 11$$......(4)
Adding Eq(1) & (4), we get $$2y=32$$ => $$y=16 cm$$
we get $$x+16=21$$ => $$x=5 cm$$
From Eq(2) => $$13^2=5^2+h^2$$
$$h^2=13^2-5^2$$ => $$h=12 cm$$
The area of the smaller triangle ABD = $$\ \frac{\ BD\times\ AD}{2}$$
= $$\ \frac{\ 5\times\ 12}{2}$$ = $$30 cm^2$$
30% of area of smaller triangle = $$30\%\ \times\ 30=9\ cm^2$$
Option (C) is the answer
The cost of setting up a utility bag factory is Rs. 1200. The cost of running the factory is Rs. 125 per 105 bags. The cost of raw materials is 80 paise/per bag. The bags are sold at Rs. 3.25 each. 900 bags were made, but only 785 bags were sold. Other companies can advertise on both sides of the bag. What is the approximate sum to be obtained from the advertisements being printed on the bags to give a profit of 12%?
Solution
It is given that 900 bags were made, and only 785 were sold.
Cost of manufacturing 900 bags $$=1200+\frac{125}{105}\times\ 900+0.80\times\ 900$$ $$=\ Rs. \frac{20940}{7}$$.....(1)
Revenue of the factory = Amount from sales + Amount from advertisements......(2)
Let the amount from advertisements be $$ Rs. 'y'$$
Amount from sales = $$785\times\ 3.25= Rs. 2551.25$$
Factory's profit percentage = 12%.....(3)
From Eq (1), (2) & (3)
We get, $$2551.25\ +y=\frac{20940}{7}\ \times\ 1.12$$
On solving, we get $$y=Rs.\ 799.15$$
Hence the approximate revenue from advertisements is = $$Rs.\ 799$$
Option (C) is the answer.
An investor lent-out a certain sum on simple interest and the same sum on compound interest at the same rate of interest per annum. He noticed that the ratio of the difference of the compound interest and the simple interest for 4 years to the difference of the compound interest and the simple interest for 3 years is 20:8. The approximate rate of interest per annum is given by,
Solution
Let '$$p$$' be the principal amount and '$$r$$' be the interest rate per annum.
Simple Interest for t years = $$ptr$$
Compound Interest for t years = $$p\left(1+r\right)^t-p$$
From the given information,
$$\frac{\left(p\left(1+r\right)^4-p\right)-4pr}{\left(p\left(1+r\right)^3-p\right)-3pr}=\frac{20}{8}$$
$$\frac{\left(\left(1+r\right)^4-1\right)-4r}{\left(\left(1+r\right)^3-1\right)-3r}=\frac{5}{2}$$
$$2\times\ \left(\left(1+r\right)^4-1-4r\right)=5\times\ \left(\left(1+r\right)^3-1-3r\right)$$
$$2\times\ \left(1+r\right)^4-2-8r=5\times\ \left(1+r\right)^3-5-15r$$
$$2\times\ \left(1+r\right)^4=5\times\ \left(1+r\right)^3-3-7r$$
$$\ 2r^4+8r^3+12r^2+8r+2=\ 5r^3+15r^2+15r+5-3-7r$$
$$\ 2r^4+8r^3+12r^2=\ 5r^3+15r^2$$
$$\ 2r^2+3r-3=0$$
Hence, $$r=\frac{-3\pm\ \sqrt{\ 9+24}}{2\times\ 2}$$
$$r=\frac{-3\pm\ \sqrt{\ 33}}{4}$$
As interest rate cannot be negative,
$$r=\frac{-3+\ \sqrt{\ 33}}{4}$$
$$r=0.6861$$
Hence, the approximate value of $$r=69\%$$
Option (A) is correct.
Find the largest 5 digit number which when divided by 4, 9, and 11 leaves the same but largest remainder for all the three numbers ?
Solution
The largest remainder we can get, = smallest of {largest remainder of '4', the largest remainder of '11', the largest remainder of '9'}
= smallest of {3,10,8} = 3.
The number which gives the remainder '3', when divided by 4,9& 11, will be of the form = L.C.M of (4,9&11) x n + 3.
L.C.M of (4,9&11) = 396.
The number which gives the remainder '3', when divided by 4,9& 11, will be of the form = 396n+3.
The largest 5-digit number of the form, 396n+3 = 396 x 252 + 3
=99792+3=99795.
Option (D) is correct.

Four sprinters start running from 4 points which are 4 corners of an imaginary rectangle along straight lines and meet at a point 'O' which falls inside the rectangle as shown in the figure, after the first three sprinters run 55m, 65m and 75m respectively. What is the approximate distance that the fourth sprinter will run to meet the other three sprinters at point O?
Solution

From the above figure,
Using Pythagoras theorem
$$In\ \triangle\ AQO\ ,\ 55^2=a^2+c^2$$.....(1)
similarly.
$$In\ \triangle\ BQO\ ,\ 65^2=a^2+d^2$$.....(2)
$$In\ \triangle\ CSO\ ,\ 75^2=b^2+d^2$$.....(3)
$$In\ \triangle\ DSO\ ,\ m^2=b^2+c^2$$.....(4)
From observation, Eq(1)-Eq(2) = Eq(4)-Eq(3) = $$c^2-d^2$$
Hence, $$55^2-65^2=m^2-75^2$$
$$3025-4225=m^2-5625$$
$$m^2=4425$$
$$m=\pm\ 66.52$$
As 'm' cannot be negative
$$m\approx\ \ 66.5$$
Option (A) is correct.
Let integer $$\alpha$$ be one of the roots of $$ax^2 + 2x + 3 = 0$$ and integer $$\beta$$ be one of the roots of $$5x^2 + bx + 8 = 0$$. It is also given that $$\alpha = \beta^2$$. Which of the following statement is true if $$b = -14$$?
Solution
$$64\times\ \frac{-11}{16}+4\times\ -\frac{11}{16}\times\ 4^2+32\times\ -\frac{11}{16}\times\ 4$$It is given that b=-14.
Then the eq $$5x^2 + bx + 8 = 0$$ becomes $$5x^2 -14x + 8 = 0$$.
$$x=\frac{-b\pm\ \sqrt{\ b^2-4ac}}{2a}=\frac{14\pm\ \sqrt{\ 196-160}}{10}$$
$$=\frac{14\pm\ 6}{10}$$
$$x=2\ or\ 0.8$$
It is given that $$\beta\ $$ is an integer & a root of $$ 5x^2 + bx + 8 = 0$$.Hence $$\beta=2$$.
If $$\beta=2$$, Then $$\alpha = \beta^2$$ = $$4$$.
As $$\alpha$$ is a root of $$ax^2 + 2x + 3 = 0$$
$$4^2a+8+3=0$$
$$a=-\frac{11}{16}$$.
By verifying options, Option D satisfies for the a & b values.
= $$64\times\ \frac{-11}{16}+4\times\ -\frac{11}{16}\times\ \left(-14\right)^2+32\times\ -\frac{11}{16}\times\ -14$$
$$=\ -275$$
Hence Option (D) is the answer.
Find the value of x such that
$$(1 - x)^{\frac{3}{2}} + (1 + x)^{\frac{3}{2}} + 2(\sqrt{1 - x^2}) = (2 + 2\sqrt{1 - x^2})^{\frac{3}{2}}$$
Solution
Let $$\sqrt{\ 1-x}=a\ \&\ \sqrt{\ 1+x}=b$$
R.H.S = $$(2 + 2\sqrt{1 - x^2})^{\frac{3}{2}}$$
=$$(1+x+1-x + 2\sqrt{(1 - x)(1+x)})^{\frac{3}{2}}$$
=$$(a^2+b^2+ 2ab)^{\frac{3}{2}}$$
=$$\left(a+b\right)^{2\times\ \frac{3}{2}}$$
=$$\left(a+b\right)^3$$
L.H.S = $$(1 - x)^{\frac{3}{2}} + (1 + x)^{\frac{3}{2}} + 2(\sqrt{1 - x^2})$$
= $$a^3+b^3+2ab$$
=$$\left(a+b\right)^3-3ab(a+b)+2ab$$
Equating L.H.S & R.H.S, we get
$$\left(a+b\right)^3-3ab(a+b)+2ab = \left(a+b\right)^3$$
$$a+b=\frac{2}{3}$$
substituting the values of 'a' & 'b' we get
$$\sqrt{\ 1-x}+\sqrt{\ 1+x}=\frac{2}{3}$$
squaring on both sides, we get
$$1-x+1+x+2\sqrt{\ 1-x^2}=\frac{4}{9}$$
$$2\sqrt{\ 1-x^2}=\frac{4}{9}-2$$
$$\sqrt{\ 1-x^2}=\frac{-7}{9}$$
Squaring on both sides
$$1-x^2=\frac{49}{81}$$
$$x^2=\frac{32}{81}$$
$$x=\frac{4\sqrt{\ 2}}{9}$$
Hence, option (D) is the answer.
An integer is called a perfect square if it is square of another integer. The number of perfect square points, i.e. $$x$$ and $$y$$ are both perfect squares such that $$(x,y)$$ lies exactly within the circle
$$(x - 12)^2 + (y - 10)^2 = 64$$, is
Solution
The given equation is $$(x - 12)^2 + (y - 10)^2 = 64$$
$$(x - 12)^2 + (y - 10)^2 = 8^2$$
It is an equation of a circle with a radius of 8 units & its centre is at (12,10).
It implies that the extreme coordinate of 'x' is = 12+8 = 20.
Similarly, the extreme coordinate of 'y' is = 10+8 = 18.
The square numbers which are less than 20 & 18 are 4, 9 & 16.
For a point (x,y) to lie inside the circle, $$(x - 12)^2 + (y - 10)^2 = 64$$, the value of $$(x - 12)^2 + (y - 10)^2$$ should be less than 64.
Case (i):- (4,4)
$$(4-12)^2+(4-10)^2=8^2+6^2=100 > 64$$.
Hence, the point lies outside the circle.
As $$(4-12)^2=64$$, all the square points with '4' as x coordinate i.e (4,9), (4,16), lie outside the circle.
Case (ii):- (9,9)
$$(9-12)^2+(9-10)^2=3^2+1^2=10 < 64$$.
Hence, the point lies inside the circle.
Case (iii):- (16,16)
$$(16-12)^2+(16-10)^2=4^2+6^2=52 < 64$$.
Hence, the point lies inside the circle.
Case (iv):- (9,4)
$$(9-12)^2+(4-10)^2=3^2+6^2=45 < 64$$.
Hence, the point lies inside the circle.
Case (v):- (9,16)
$$(9-12)^2+(16-10)^2=3^2+6^2=45 < 64$$.
Hence, the point lies inside the circle.
Case (vi):- (16, 4)
$$(16-12)^2+(4-10)^2=4^2+6^2=52 < 64$$.
Hence, the point lies inside the circle.
Case (vii):- (16, 16)
$$(16-12)^2+(16-10)^2=4^2+6^2=52 < 64$$.
Hence, the point lies inside the circle.
A total of 6 perfect square points lie inside the circle.
Option 'C' is the answer.
An n-digit number is a positive number with exactly n digits. Nine hundred distinct n-digit numbers are to be formed using digits 2,3,4,5 and 7 such that each n-digit number has the
(i) first and last digits are the same
(ii) first and third are prime numbers
(iii) second should be greater than or equal to 4.
What should be the minimum value of n such that the above is possible?
Solution
Let's consider an n-digit number.
$$_{-------------n\ digits}$$
The 900 distinct numbers have to be formed using digits 2, 3, 4, 5 and 7.
The first and last digit numbers are the same & the first and third are prime numbers
$$abc_{-----------}a\ total\ 'n'\ digits.$$
the values of a & c can be anything from 2,3,5, and 7. i.e 4 values.
The second digit should be greater than or equal to 4. Hence, b can take any value from 4, 5 & 7. i.e. 3 values.
There are no conditions from the 4th digit to the 'n-1' digit.
Hence those digits can take any value from 2, 3, 4, 5 and 7, i.e. 5 values.
For n = 4, the number of digits that can be formed $$=4\times\ 4\times\ 3=48 < 900$$
For n = 5, the number of digits that can be formed $$=4\times\ 4\times\ 3\times\ 5 = 240 < 900$$
For n = 6, the number of digits that can be formed $$=4\times\ 4\times\ 3\times\ 5\times\ 5=1200 > 900$$
Hence a minimum of 6-digit number is required to form 900 distinct numbers with given conditions.
Option (B) is correct.
Pot "A" contains 5 blue and 10 green balls, and another pot "B" contains 7 blue and 2 green balls. A biased dice with six sides numbered 1 to 6 is rolled. The probability of each odd outcome is the same, and the probability of each even outcome is the same. But the probability of an odd outcome is twice the probability of an even outcome. If the face 1 or 2 or 3 comes up, a ball is taken from the pot "A" else a ball is taken from the pot "B". Find the probability of drawing a green ball.
Solution
Let the probability of an even outcome of dice be $$'x'$$.
Then the probability of the odd outcome of the dice is $$'2x'$$.
The sum of all probabilities of all events is 1.
It implies $$x+x+x+2x+2x+2x=1$$
$$x=\frac{1}{9}$$
Probability of drawing a green ball from pot 'A' = Probability of selecting pot 'A' x probability of drawing a green ball.
= $$\left(\frac{2}{9}+\frac{1}{9}+\frac{2}{9}\right)\times\ \frac{10}{15}$$ $$=\frac{5}{9}\times\ \frac{10}{15}=\frac{10}{27}$$
Similarly, the Probability of drawing a green ball from pot 'B' = $$\left(\frac{1}{9}+\frac{2}{9}+\frac{1}{9}\right)\times\ \frac{2}{9}$$
$$=\frac{4}{9}\times\ \frac{2}{9}=\frac{8}{81}$$
Probability of drawing a green ball = Probability of drawing a green ball from pot 'A' + Probability of drawing a green ball from pot 'B'.
$$=\frac{10}{27}+\ \frac{8}{81}=\frac{38}{81}$$
Option (A) is the answer.
In 1920, the "Sahitya Shakti" society was established by 500 members who read Premchand. In 1921, due to internal conflict, it removed all 200 members who also read Shakespeare. In 1922, further the member who also read Tolstoy numbering 100 left the society. In 1923, the society added only those ex-member who read both Shakespeare and Premchand but not Tolstoy after which the Sahitya Shakti society consisted of 350 members. Which of the following is true?
Solution
The total number of members of Sahitya Shakti is 500.
Total members after removing people who read Shakespeare = 500-200=300
Total members after removing people who read Tolstoy = 300-100=200
Society added back people who read Shakespeare but not Tolstoy, and the number increased to 350.
Hence society added back 150 people. But initially, society removed 200 members.
Therefore, the other 50 members who were not added back also read Tolstoy. Those 50 members read all three books.
Option (A) False. Only 150 original members read both Premchand and Tolstoy.
Option(B) True. 50 original members read together Premchand and Shakespeare and Tolstoy
Option(C) False. 350 original members read both Premchand and Shakespeare but not Tolstoy
Option (D) False. 50 original members read both Shakespeare and Tolstoy
It is given that $$P(A \cup B) < \frac{3}{4}, P(A) > \frac{1}{8}, P\left(\frac{A}{B}\right) < \frac{1}{2}$$. Which of the following is true?
Solution
It is given that, $$P(A \cup B) < \frac{3}{4}, P(A) > \frac{1}{8}, P\left(\frac{A}{B}\right) < \frac{1}{2}$$
$$P\left(\frac{A}{B}\right)=\frac{P(A \cap B)}{P\left(B\right)}< \frac{1}{2}$$
$$2\ P(A \cap B) < P(B)$$
$$P(A \cap B) < P(B)-P(A \cap B)$$.........(1)
$$ P(A \cup B) = P(A) + P(B) - P(A \cap B) < \frac{3}{4}$$
$$ P(A) + P(B) - P(A \cap B) < \frac{3}{4}$$
$$ P(A) + (P(A \cap B) <) < \frac{3}{4}$$ From Eq (1),
$$ P(A) + P(A \cap B) < \frac{3}{4}$$
Hence Options (A), (B) & (D) are false.
$$ P(A) + P(A \cap B) < \frac{3}{4}$$
$$ (> \frac{1}{8}) + P(A \cap B) < \frac{3}{4}$$ From $$(P(A) > \frac{1}{8})$$
$$P(A \cap B) < \frac{3}{4}-\frac{1}{8}$$
$$P(A \cap B) < \frac{5}{8}$$
Option (C) is correct.
Find $$\tan^4 \alpha + \tan^4 \gamma$$ using the information given below:
$$\tan(\theta - \gamma) = \frac{1}{\sqrt{2}}, \tan \theta \tan \gamma = \tan^2 \alpha$$
Solution
Given that,
$$\tan\left(\theta\ -\gamma\ \right)=\frac{1}{\sqrt{\ 2}}$$
$$\frac{\tan\theta-\tan\gamma}{1+\tan\theta\ \tan\gamma\ }\ =\frac{1}{\sqrt{\ 2}}$$
$$\frac{\tan\theta-\tan\gamma}{1+\tan^2\alpha\ }\ =\frac{1}{\sqrt{\ 2}}$$
$$\frac{\tan\theta-\tan\gamma}{\sec^2\alpha\ }\ =\frac{1}{\sqrt{\ 2}}$$
$$\ \tan\theta\ -\tan\gamma\ =\frac{1}{\sqrt{\ 2}\cos^2\alpha\ }$$
$$\ \frac{\tan^2\alpha\ }{\tan\gamma\ }-\tan\gamma\ =\frac{1}{\sqrt{\ 2}\cos^2\alpha\ }$$
$$\ \tan^2\alpha\ -\tan^2\gamma\ =\frac{\tan\gamma\ }{\sqrt{\ 2}\cos^2\alpha\ }$$
Squaring on both sides,
$$\tan^4\alpha\ +\tan^4\gamma-2\ \tan^2\alpha\ \tan^2\gamma\ =\frac{\tan^2\gamma\ }{2\cos^4\alpha\ }$$
$$\tan^4\alpha\ +\tan^4\gamma\ =2\ \tan^2\alpha\ \tan^2\gamma+\frac{\tan^2\gamma\ }{2\cos^4\alpha\ }$$
$$\tan^4\alpha\ +\tan^4\gamma\ =\tan^2\gamma\ \left(2\ \tan^2\alpha\ +\frac{1}{2\cos^4\alpha\ }\right)$$
$$\tan^4\alpha\ +\tan^4\gamma\ =\tan^2\gamma\ \left(\ \frac{4\sin^2\alpha\ \cos^2\alpha}{2\cos^4\alpha}\ +\frac{1}{2\cos^4\alpha\ }\right)$$
$$\tan^4\alpha\ +\tan^4\gamma\ =\frac{\tan^2\gamma}{2}\ \left(\ \frac{4\sin^2\alpha\ \cos^2\alpha+1}{\cos^4\alpha}\ \right)$$
$$=\frac{\tan^2\gamma}{2}\ \left(\ \frac{6\sin^2\alpha\ \cos^2\alpha+1-2\sin^2\alpha\ \cos^2\alpha}{\cos^4\alpha}\ \right)$$
$$=\frac{\tan^2\gamma}{2}\ \left(\ \frac{6\sin^2\alpha\ \cos^2\alpha+\left(\sin^2\alpha\ +\cos^2\alpha\right)^2-2\sin^2\alpha\ \cos^2\alpha}{\cos^4\alpha}\ \right)$$
$$=\frac{\tan^2\gamma}{2}\ \left(\ \frac{6\sin^2\alpha\ \cos^2\alpha+\sin^4\alpha\ +\cos^4\alpha+2\sin^2\alpha\ \cos^2\alpha-2\sin^2\alpha\ \cos^2\alpha}{\cos^4\alpha}\ \right)$$
$$=\frac{\tan^2\gamma}{2}\ \left(\ \frac{6\sin^2\alpha\ \cos^2\alpha+\sin^4\alpha\ +\cos^4\alpha}{\cos^4\alpha}\ \right)$$
$$=\frac{\tan^2\gamma}{2}\ \left(\ 6\tan^2\alpha+\tan^4\alpha\ +1\ \right)$$
$$=\frac{\tan^2\gamma}{2}\ \left(\ \left(\tan^2\alpha+3\right)^2\ -8\ \right)$$
Option (A) is the answer.
A person standing on the bank of a river observes that the angle subtended by a tree on the opposite bank is 60 degrees. When he retires 'y' metre from the bank perpendicular to the tree, he finds the angle to be 45 degrees. When he further retires $$15 - 5\sqrt{3}$$ metre perpendicular to the tree, he finds the angle to be 30 degrees. Find the height of the tree in metres?
Solution
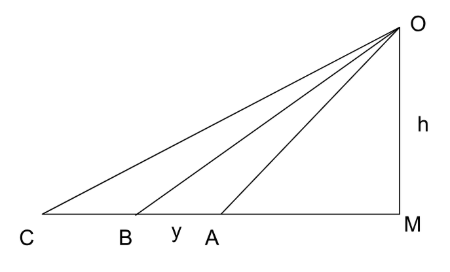
It is given that $$\angle\ OAM=60^{\circ\ },\ \angle\ OBM=45^{\circ},\ \angle\ OCM=30^{\circ\ },\ AB=y,\ BC=15-5\sqrt{\ 3}\ $$
Let the height of the tree be OM = $$'h'$$.
Then $$AM\ =\dfrac{OM}{\tan\ 60^{\circ\ }}=\dfrac{h}{\sqrt{\ 3}}$$
From $$\triangle\ OBM,\ \tan\ 45^{\circ\ }=\dfrac{h}{\dfrac{h}{\sqrt{\ 3}}+y}$$
$$\dfrac{h}{\sqrt{\ 3}}+y=h$$
$$y=h-\dfrac{h}{\sqrt{\ 3}}$$
From $$\triangle\ OCM,\ \tan30^{\circ\ }=\dfrac{h}{15-5\sqrt{\ 3}+y+\dfrac{h}{\sqrt{\ 3}}}$$
$$\dfrac{1}{\sqrt{\ 3}}=\dfrac{h}{15-5\sqrt{\ 3}+h-\dfrac{h}{\sqrt{\ 3}}+\dfrac{h}{\sqrt{\ 3}}}$$
$$\dfrac{1}{\sqrt{\ 3}}=\dfrac{h}{15-5\sqrt{\ 3}+h}$$
$$15-5\sqrt{\ 3}+h=h\sqrt{\ 3}$$
$$15-5\sqrt{\ 3}=h\left(\sqrt{\ 3}-1\right)$$
$$h=\dfrac{15-5\sqrt{\ 3}}{\left(\sqrt{\ 3}-1\right)}$$
$$h=\dfrac{5\sqrt{\ 3}\times\ \left(\sqrt{\ 3}-1\right)}{\left(\sqrt{\ 3}-1\right)}=5\sqrt{\ 3}$$
Option (C) is the answer.
Let a - d, a, a + d, a + 2d be four terms of an arithmetic progression with integer entries and a, a + d, a + 2d, a + 3d be another four terms of the same arithmetic progression. Let $$x = a(a - d) (a + d) (a + 2d) + d^4$$ and $$y = a(a + d) (a + 2d) (a + 3d) + d^4$$. Then x + y is equal to ?
Solution
Given that $$x = a(a - d) (a + d) (a + 2d) + d^4$$
$$x=a\left(a-d\right)\left(a+d\right)\left(a+2d\right)+d^4$$
$$=a\left(a+d\right)\left(a-d\right)\left(a+2d\right)+d^4$$
$$=\left(a^2+ad\right)\left(a^2+2ad-ad-2d^2\right)+d^4$$
Let $$t=a^2+ad$$
$$x=\left(t\right)\left(t-2d^2\right)+d^4$$
$$x=t^2-2td^2+d^4$$
$$x=\left(t-d^2\right)^2$$
Substituting $$t=a^2+ad$$
$$x=\left(a^2+ad-d^2\right)^2$$.........(1)
Given that, $$y = a(a + d) (a + 2d) (a + 3d) + d^4$$
$$y=a\left(a+d\right)\ \left(a+2d\right)\ \left(a+3d\right)+d^4$$
$$=a\left(a+3d\right)\ \left(a+d\right)\ \left(a+2d\right)+d^4$$
$$=\left(a^2+3ad\right)\ \left(a^2+2ad+ad+2d^2\right)+d^4$$
$$=\left(a^2+3ad\right)\ \left(a^2+3ad+2d^2\right)+d^4$$
Let $$t=a^2+3ad$$
$$=\left(t\right)\ \left(t+2d^2\right)+d^4$$
$$=t^2+2td^2+d^4$$
$$=\left(t+d^2\right)^2$$
Substituting $$t=a^2+3ad$$
$$y=\left(a^2+3ad+d^2\right)^2$$.........(2)
From Eq (1) & (2)
We get, $$x+y=\left(a^2-d^2+ad\right)^2+\left(a^2+d^2+3ad\right)^2$$
Option (D) is correct.
A green liquid is mixed with a blue liquid in the proportion 4 : 5 and the mixture is sold at Rs. 20 per litre at a 20% profit. If the green liquid costs Rs. 4 more per litre than the blue liquid, what does the green liquid cost per litre approximately.
Solution
Let the cost of blue liquid per litre be $$'x'$$
then the cost of green liquid per litre is $$'x+4'$$
The S.P. of the mixture is Rs 20 per litre, and the profit % is 20%.
Then C.P. of the mixture per litre = $$\frac{20}{1+0.2}=\frac{20}{1.2}=\frac{50}{3}$$......(1)
Also, the C.P. of the mixture per litre is given by = $$\frac{4\left(x+4\right)+5\left(x\right)}{5+4}=\frac{9x+16}{9}$$.....(2)
Equating (1) to (2)
we get $$\frac{50}{3}=\frac{9x+16}{9}$$
$$150=9x+16$$
$$9x=134$$
$$x=14.88$$
Hence, the cost of green liquid per litre is = 14.88+4= 18.88.
Option (B) is correct.
Two trains of equal length are running on parallel lines in the same direction at 54km/hour and 40km/hour. The slower train started first and then the faster train started after some time. The faster train passes the length of the slower train in 36 seconds completely. The length of each train is?
Solution
Let the length of both trains be $$'x'$$.
The speeds of trains are 54Kmph & 40Kmph.
The faster train passes the length of the slower train in 36 seconds.
It implies, $$\frac{x+x}{54-40}=\frac{36}{60\times\ 60}$$
$$\frac{2x}{14}=\frac{36}{60\times\ 60}$$
$$x=0.07\ Km$$
$$x=70\ m$$.
Hence, Option (B) is correct.

AB and CD are two chords intersecting at point E. Ram started from point A with a speed of 2km/hr. After reaching point E, Ram moved to point D with same speed and covered ED in one-fifth of the time taken for AE. Similarly. Shyam moved from point C to point B through point E. If Shyam takes in total 18 hours to cover the whole distance from C to B through point E with same speed. what is the time Shyam took to cover BE?
Solution

It is given that Ram covers ED in one-fifth of the time taken for AE, with a 2km/hr constant speed.
It implies, $$\frac{1}{5}\times\ \frac{AE}{2}\ =\frac{ED}{2}$$
$$AE\ =5\times\ ED$$......(1)
Let the speed of Shyam be 's' Kmph. He covers the whole distance from C to B through point E at the same speed in 18 hours.
It implies, $$\frac{CE+BE}{S}=18 Hrs$$.......(2)
From the properties of circles, $$AE\times\ BE=CE\times\ DE$$
$$5DE\times\ BE=CE\times\ DE$$ [From EQ(1)]
$$CE=5BE$$......(3)
From EQ(2) & (3)
$$\frac{5BE+BE}{S}=18$$
$$\frac{6BE}{S}=18$$
$$\frac{BE}{S}=3\ Hrs.$$
Option (C) is the answer.

Find the area of the shaded region. Given that ABCD is a square with side length 'b' units and E is the midpoint of AB.
Solution
For Triangle ECD,
$$EC=DE=\sqrt{\ b^2+\left(\frac{b}{2}\right)^2}=\frac{\sqrt{\ 5}b}{2}$$
CD = b
$$Area\ of\ \triangle\ ECD=r\times\ s$$....(1)
$$s=\frac{\left(\frac{\sqrt{\ 5}b}{2}+\frac{\sqrt{\ 5}b}{2}+b\right)}{2}=\frac{b\left(\sqrt{\ 5}+1\right)}{2}$$...(2)
$$Area\ of\ \triangle\ ECD\ =\ \frac{B\times\ H}{2}=\frac{b\times\ b}{2}=\frac{b^2}{2}$$.......(3)
From EQ (1), (2) & (3)
we get, $$\frac{b^2}{2}=\frac{b\left(\sqrt{\ 5}+1\right)}{2}\times\ r$$
$$\ r=\frac{b}{\sqrt{\ 5}+1}=\frac{b\left(\sqrt{\ 5}-1\right)}{4}$$
Area of the incircle of ECD = $$\ \pi\ r^2$$
= $$\ \pi\ \times\ \left(\frac{b\left(\sqrt{\ 5}-1\right)}{4}\right)^2$$
$$=\frac{\pi\ b^2\left(5+1-2\sqrt{\ 5}\right)}{16}=\frac{\pi\ b^2\left(3-\sqrt{\ 5}\right)}{8}$$....(4)
For Triangle AED,
Inradius, $$r=\frac{AE+AD-DE}{2}=\frac{b+\frac{b}{2}-\frac{\sqrt{\ 5}b}{2}}{2}=\frac{b\left(3-\sqrt{\ 5}\right)}{4}$$
Area of the incircle of Triangle AED, = $$\frac{\pi\ b^2\ \left(3-\sqrt{\ 5}\right)^2}{4^2}$$
$$=\pi\ b^2\ \frac{\left(9+5-6\sqrt{\ 5}\right)}{16}=\frac{\pi\ b^2\ \left(14-6\sqrt{\ 5}\right)}{16}$$......(5)
As, Triangle AED $$\simeq\ $$ Triangle BEC
Area of the incircle of $$\triangle\ AED$$ = Area of the incircle of $$\triangle\ BEC$$.
Hence, the area of the shaded region $$=\frac{\pi\ b^2\left(14-6\sqrt{\ 5}\right)}{16}+\frac{\pi\ b^2\left(14-6\sqrt{\ 5}\right)}{16}+\frac{\pi b^2\ \left(3-\sqrt{\ 5}\right)}{8}$$
$$=\frac{\pi\ b^2}{16}\times\ \left(14-6\sqrt{\ 5}+14-6\sqrt{\ 5}+6-2\sqrt{\ 5}\right)$$
$$=\frac{\pi\ b^2\left(34-14\sqrt{\ 5}\right)}{16}$$
A large solid iron sphere of diameter 10m is melted and 2/5 of the melted amount is recast into several small spheres of diameter 2m. What is the ratio of the total surface area of the smaller spheres and the surface area of the large sphere?
Solution
Volume of large sphere$$=\frac{4\pi\ }{3}\times\ \left(\ \frac{\ 10}{2}\right)^3=\frac{4\pi\times\ 5^3\ }{3}$$
2/5 of the volume is recast into several spheres of 2m diameter.
Let the number of small spheres be '$$n$$'
$$n\times\ \frac{4\pi}{3}\times\ \left(\frac{2}{2}\right)^3\ =\frac{2}{5}\times\ \frac{4\pi\times\ 5^3\ }{3}$$
On solving, we get $$n=50$$.
The ratio of the total surface area of the smaller spheres and the surface area of the large sphere= $$\left(50\times\ 4\pi r^2\right)\ :\ \left(4\pi R^2\right)$$
= $$\left(50\times\ 4\pi\left(1\right)^2\right)\ :\ \left(4\pi\left(5\right)^2\right)$$
$$=2\ :\ 1$$
:Read the following Passage and Answer the questions given below:
You absolutely must develop feelings of self-esteem and confidence to become empowered. No amount of willpower can surmount the feeling of defeatism. Any negative thoughts will filter into your subconscious mind, which does not question or analyze the data it receives. If you have experienced repeated failure in past attempts to change a behavior pattern, your total self-image becomes established and fixed as one of failure. You become so convinced that you are incapable of reversing this trend that you eventually stop picturing a desirable goal for yourself. You resign yourself to accepting the current situation as being permanent and helpless.
A positive self-image must be fed into your subconscious mind without being evaluated by the critical factor of your conscious mind proper (defense mechanisms). The most efficient and effective method of accomplishing this goal is by practicing self-hypnosis.
Although many obstacles may arise during your consciousness raising program, the proper use of self-programming will transform these former roadblocks into stepping-stones of success. Once you envision succeeding in your goals, former difficulties disappear, and the subconscious becomes your chief ally in strengthening your ability to meet challenges.
The subconscious mind contains all memories. It is a natural computer and is continually being programmed with data originating from the conscious mind proper. The subconscious cannot alter this data; however~ it does direct the conscious mind to act in a specific way. The conscious mind is always resistant to change, any change, even if it is for the better. The conscious mind likes business as usual. Consciousness raising and behavioral changes are not business as usual; therefore, the conscious mind is your only enemy.
By seeing yourself as you desire to be, you are reprogramming your subconscious computer. This does not require a critical acceptance, because your subconscious is incapable of analytical thought. Accompanying this visualization will be a feeling that you have already attained this goal. This as-if approach is remarkably successful.
Once you achieve a particular goal using the subconscious mind~ the maintenance of this goal will be effortless. When something attempts to interfere with the proper functioning of the reprogrammed subconscious, your internal computer will recognize the error immediately, and it will be corrected by this feedback mechanism.
Your initial efforts in reprogramming the subconscious require a certain amount of mental training, which encompasses all new goals and aspirations. Daily practice of the exercises self-hypnosis, yoga~ hetero-hypnosis, and trance results in a permanent reprogramming of the subconscious computer and a spontaneous incorporation of this goal. Willpower is neither necessary nor desirable for this paradigm. This is one example of raising consciousness.
Your imagination can create a new mental image of yourself. If you have properly implanted the subconscious with positive images and suggestions, you automatically alter your behavior to act in accordance with this new programming. A new sense of well-being and accomplishment accompany this pattern of behavior. You will be able to feel this sense of confidence and empowerment for prolonged periods following additional practice sessions.
Willpower alone cannot result in permanent changes in behavior. The problem with the willpower approach is that you are consciously placing too much emphasis on past failures. As a result, your mental mindset is not conducive to improvement, and subsequent efforts prove only more frustrating. Success in applying consciousness-raising techniques depends on the subconscious mind's uncritical acceptance of constructive suggestions. Thus, the most effective method of achieving this is through the use of self-hypnosis.
To change one s mind from 'negativity to 'positivity or to change one's behaviour permanently, which of the following is the most effective way?
Solution
Option D is the most effective way to change negativity because it aligns with the passage's view of the subconscious mind. The passage describes the subconscious as a "natural computer" that readily accepts information without analysis. Bypassing the critical conscious mind with positive images and suggestions (uncritical acceptance) directly feeds this "computer" with the desired program for positivity, leading to a more positive outlook and behavior change.
Option A goes against the passage's emphasis on using positive and productive suggestions.
Option B: While analyzing suggestions can be helpful, the passage highlights the subconscious mind's uncritical nature.
Option C creates a contradiction. Critical acceptance implies analyzing, which goes against the idea of uncritical suggestions.
What is the most effective way to permanently reprogram one's subconscious mind?
Solution
Option A aligns with the passage's ideas because it combines:
Self-hypnosis: This technique, according to the passage, allows for direct positive programming of the subconscious mind.
Daily practice: Repetition strengthens the new positive suggestions in the subconscious.
Targeted goal: Focusing on a specific goal during self-hypnosis helps channel the subconscious mind's power towards achieving that goal.
Option B: The passage argues that willpower alone is not enough. It can be weakened by focusing on past failures.
Option C: While feeding your conscious mind with positivity is a good start, the passage emphasizes directly influencing the subconscious, which bypasses the critical conscious mind.
Option D: The passage suggests that after the initial reprogramming with self-hypnosis, the subconscious mind itself helps maintain the positive changes. So, constant effort wouldn't be necessary.
Which of the following about using willpower to bring permanent changes in behaviour' is not correct according to passage?
Solution
Option C is incorrect based on the passage because the passage doesn't directly state that willpower leads to establishing one's total self-image as a failure. Instead, it suggests that relying solely on willpower can emphasize past failures, which in turn can hinder improvement. The passage highlights that the problem with the willpower approach is that it places too much emphasis on past failures, contributing to a mental mindset that is not conducive to improvement. However, it does not explicitly state that willpower directly leads to establishing one's total self-image as a failure.
According to the passage, the subconscious mind .... :
Solution
The passage highlights that the subconscious mind is influenced by what we feed it from the conscious mind. It doesn't analyze this information critically and can be reprogrammed with positive self-image, making Option C the most accurate choice. The conscious mind, according to the passage, is the one resistant to change, not the subconscious.
Option A: The passage describes the subconscious as lacking critical thinking and not questioning information it receives.
Option B: While negativity can impact the subconscious, the passage doesn't say it happens instantly. It emphasizes the role of repeated failures in shaping self-image.
Option D:The passage argues against critical acceptance. It suggests bypassing the critical conscious mind with positive suggestions directly to the subconscious (through self-hypnosis).
Read the following Passage and Answer the questions given below:
Widespread currency manipulation, mainly in developing and newly industrialized economies, is the most important development of the past decade in international financial markets. In an attempt to hold-down the values of their currencies, governments are distorting capital flows by around $1.5 trillion per year. The result is a net drain on aggregate demand in the United States and the Euro area by an amount roughly equal to the large output gaps in the United States and the Euro area. In other words, millions more Americans and Europeans would be employed if other countries did not manipulate their currencies and instead achieved sustainable growth through higher domestic demand.
The United States has lost 1 million to 5 million jobs due to this foreign currency manipulation. More than 20 countries have increased their aggregate foreign exchange reserves and other official foreign assets by an annual average of nearly $1. 5 trillion in recent years. This build-up of official assets-mainly through intervention in the foreign exchange markets; keeps the currencies of the interveners substantially undervalued, thus boosting their international competitiveness and trade surpluses. The corresponding trade deficits are spread around the world, but the largest share of the loss centers on the United States, whose trade deficit has increased by $200 billion to $500 billion per year as a result.
The United States must tighten fiscal policy over the coming decade to bring its national debt under control. Monetary policy has already exhausted most of its expansionary potential. Hence the United States must eliminate or at least sharply reduce its large trade deficit to accelerate growth and restore full employment. The way to do so, at no cost to the US budget, is to insist that other countries stop manipulating their currencies and permit the dollar to regain a competitive level. This can be done through steps fully consistent with the international obligations of the United States that are indeed based on existing International Monetary Fund (IMF) guidelines.
Such a strategy should in fact attract considerable support from other countries that are adversely affected b the manipulation, including Australia, Canada, the euro area, Brazil, India, Mexico, and a number of other developing economies. The strategy would aim to fill a major gap in the existing international financial architecture: its inability to engage surplus countries, even when they blatantly violate the legal strictures against competitive currency undervaluation, in an equitable sharing of global rebalancing requirements.
The United States and its allies should first seek voluntary agreement from the manipulators to sharply reduce or eliminate their intervention. The United States should inform the manipulators that if they do not do so, the United States will adopt four new policy measures against their currency activities. First, it will undertake countervailing currency intervention (CCI) against countries with convertible currencies by buying amounts of their currencies equal to the amounts of dollars they are buying themselves, to neutralize the impact on exchange rates. Second, it will tax the earnings on, or restrict further purchases of, dollar assets acquired by intervening countries with inconvertible currencies (where CCI could therefore not be fully effective to penalize them for building up these positions. Third, it will hereafter treat manipulated exchange rates as export subsidies for purposes of levying countervailing import duties. Fourth, hopefully with a number of other adversely affected countries, it will bring a case against the manipulators in the World Trade Organization (WTO) that would authorize more wide-ranging trade retaliation.
The term "currency manipulation" by the developing and newly industrialized economies a mentioned in the pa sage can be explained as ..............
Solution
Option B is the most accurate explanation of "currency manipulation" because it describes the core practice the passage criticizes. The passage argues that developing economies are intentionally keeping their currencies' value low (depreciated) through various financial tools. This manipulation gives their exports an unfair advantage by making them cheaper in the global market. Option B captures this essence of artificial undervaluation through financial instruments, which is the crux of the currency manipulation concern raised in the passage.
Option A doesn't directly address the manipulation of the domestic currency itself.
Option C: Pegging a currency to market forces would be the opposite of manipulation, which involves artificial control.
Option D: The passage focuses on manipulation by developing economies to gain an export advantage, not manipulation by developed countries.

What do you comprehend from the sentence "the result is a net drain on aggregate demand in the United States and the Euro area"?
Solution
The passage argues that currency manipulation by developing economies leads to a net drain on aggregate demand in the US and Eurozone. This means there's a decrease in overall spending in these economies. This can happen because:
Consumers in the US and Eurozone might find imported goods (from the manipulating countries) cheaper, leading them to buy less domestically produced goods.
Businesses in the US and Eurozone might struggle to compete with cheaper exports from manipulating countries, leading to lower production and potentially job losses. This reduces overall economic activity and spending.
Therefore, Option D captures the broader concept of lost economic opportunities due to the manipulation and its negative impact on domestic demand in the US and Eurozone.
What kind of retaliatory action is most likely to be taken by the United States against the manipulator countries which have convertible currency?
Solution
Option C is the correct answer as the passage explicitly states this as the first measure the US would employ.
Option A is mentioned as a fourth potential measure, after countervailing currency intervention.
Option B is a third potential measure, following countervailing currency intervention.
Option D is presented as the final option, potentially pursued with other affected countries.
Based on the learning from the passage, which of the following statement is not false?
Solution
Option C aligns with the passage, which suggests that one of the proposed policy measures to address currency manipulation is to treat manipulated exchange rates as export subsidies for the purpose of levying countervailing import duties. Therefore, option c is not false according to the passage.
Option A: The passage suggests that the USA and the Euro area could enhance employment opportunities if other countries stop manipulating their currencies, which implies that they may still be able to increase employment even without currency manipulation by other countries.
Option B: The passage does not mention leveraging extraordinary banking policy instruments to reduce the current account deficit. It primarily focuses on policy measures related to currency manipulation.
Option D: The passage states that the United States has experienced a trade deficit as a result of currency manipulation, so it is not an exception to the trade deficit phenomenon.
Read the following Passage and Answer the questions given below:
The international economy almost certainly will continue to be characterized by various regional and national economies moving at significantly different speeds, a pattern reinforced by the 2008 global financial crisis. The contrasting speed across different regional economies are exacerbating global imbalances and straining governments and the international system. The key question is whether the divergences and increased volatility will result in a global breakdown and collapse or whether the development of multiple growth centres will lead to resiliency. The absence of a clear hegemonic economic power could add to the volatility. Some experts have compared the relative decline in the economic weight of the US to the late 19th century when economic dominance by one player, Britain; receded into multi-polarity.
During the next 15 - 20 years, as power becomes even more diffuse than today, a growing number of diverse state and non-state actors, as well as subnational actors, such as cities, will play important governance roles. The increasing number of players needed to solve major transnational challenges, and their discordant values, "will complicate decision-making. The lack of consensus between and among established and emerging powers suggests that multilateral governance to 2030 will be limited at best. The chronic deficit probably will reinforce the trend toward fragmentation. However, various developments, positive or negative; could push the world in different directions. Advances cannot be ruled out despite growing multi-polarity, increased regionalism, and possible economic slowdowns. Prospects for achieving progress on global issues will vary across issues.
The governance gap "will continue to be most pronounced at the domestic level and driven by rapid political and social changes. The advances during the past couple decades in health, education, and income-which we expect to continue, if not accelerate in some cases; will drive new governance structures. Transitions to democracy are much more stable and long-lasting when youth bulges begin to decline and incomes are higher. Currently about 50 countries are in the awkward stage between autocracy and democracy, with the greatest number concentrated in Sub-Saharan Africa, Southeast and Central Asia! and the Middle East and North Africa. Both social science theory and recent history, the Color Revolutions and the Arab Spring, support the idea that with maturing age structures and rising incomes, political liberalization and democracy "will advance. However, many countries "will still be zig-zagging their way through the complicated democratization process during the next 15-20 years. Countries moving from autocracy to democracy have a proven track record of instability.
Other countries will continue to suffer from a democratic deficit: in these cases a country's developmental level is more advanced than its level of governance. Gulf countries and China account for a large number in this category. China, for example, is slated to pass the threshold of US $15,000 per capita purchasing power parity (PPP) in the next five years, which is often a trigger for democratization. Chinese democratization could constitute an immense "wave," increasing pressure for change on other authoritarian states.
The widespread use of new communications technologies will become a double-edged sword for governance. On the one hand! social networking will enable citizens to coalesce and challenge governments, as we have already seen in Middle East. On the other hand such technologies will provide governments both authoritarian and democratic: an unprecedented ability to monitor their citizens. It is unclear how the balance will be struck between greater IT-enabled individuals and networks and traditional political structures. In our interactions, technologists and political scientists have offered divergent views. Both sides agree, however, that the characteristics of IT use; multiple and simultaneous action, near instantaneous responses, mass organization across geographic boundaries, and technological dependence; increase the potential for more frequent discontinuous change in the international system.
According to the passage, which of the following is not a notable cause of multi-polarity.
Solution
According to the passage,Option D is not a notable cause of multi-polarity.
Option A is mentioned in the line, “The absence of a clear hegemonic economic power could add to the volatility.”
Option B is discussed in the line, “The international economy almost certainly will continue to be characterized by various regional and national economies moving at significantly different speeds…”
Option C is indicated in the line, “The contrasting speed across different regional economies are exacerbating global imbalances and straining governments and the international system.”
According to passage, which of the following will cause chronic deficit in multilateral governance ?
Solution
The passage mentions that “a growing number of diverse state and non-state actors, as well as subnational actors, such as cities, will play important governance roles” and “their discordant values will complicate decision-making.” This suggests that the decentralized decision structures and discordant values could lead to a chronic deficit in multilateral governance which aligns with Option B.
Option A,C and D are not explicitly mentioned in the passage.
According to passage, which of the following is/are not a trigger(s) for democratization.
I. Maturing age structure
II. Risin g income
III. Rising Human Development Index
IV. Religious beliefs
Solution
The passage mentions that “Transitions to democracy are much more stable and long-lasting when youth bulges begin to decline and incomes are higher,” which indicates that maturing age structures (I) and rising incomes (II) trigger democratization.
Option III and Option IV are not mentioned as triggers for democratisation in the passage.
According to the passage, the Widespread use of communication technologies will lead to .......?
Solution
The passage mentions that “the characteristics of IT use; multiple and simultaneous action, near instantaneous responses, mass organization across geographic boundaries, and technological dependence; increase the potential for more frequent discontinuous change in the international system.” This aligns with Option A.
Options B, C and D are not mentioned in the passage.
Read the following Passage and Answer the questions given below:
Nine years ago, when Japan was beating America's brains out in the auto industry, I wrote a column about playing the computer geography game Where in the World Is Carmen Sandiego? with my then nine-year-old daughter, Orly. I was trying to help her by giving her a clue suggesting that Carmen had gone to Detroit, so I asked her, "Where are cars made?" And without missing a beat she answered, "Japan."
Ouch!
Well, I was reminded of that story while visiting Global Edge, an Indian software design firm in Bangalore. The company's marketing manager, Rajesh Rao, told me that he had just made a cold call to the VP for engineering of a U.S. company, trying to drum up business. As soon as Mr. Rao introduced himself as calling from an Indian software firm, the U.S. executive said to him, "Namaste," a common Hindi greeting. Said Mr. Rao, "A few years ago nobody in America wanted to talk to us. Now they are eager." And a few even know how to say hello in proper Hindu fashion. So now I wonder: If I have a granddaughter one day, and I tell her I'm going to India, will she say, "Grandpa, is that where software comes from?"
No, not yet, honey. Every new product-from software to widgets - goes through a cycle that begins with basic research, then applied research, then incubation, then development, then testing, then manufacturing, then deployment, then support, then continuation engineering in order to add improvements. Each of these phases is specialized and unique, and neither India nor China nor Russia has a critical mass of talent that can handle the whole product cycle for a big American multinational. But these countries are steadily developing their research and development capabilities to handle more and more of these phases. As that continues, we really will see the beginning of what Satyam Cherukuri, of Sarnoff, an American research and development firm, has called "the globalization of innovation" and an end to the old model of a single American or European multinational handling all the elements of the product development cycle from its own resources. More and more American and European companies are outsourcing significant research and development tasks to India, Russia, and China.
According to the information technology office of the state government in Karnataka, where Bangalore is located, Indian units of Cisco Systems, Intel, IBM, Texas Instruments, and GE have already filed a thousand patent applications with the U.S. Patent Office. Texas Instruments alone has had 225 U.S. patents awarded to its Indian operation. "The Intel team in Bangalore is developing microprocessor chips for high-speed broadband wireless technology, to be launched in 2006," the Karnataka IT office said, in a statement issued at the end of 2004, and "at GE's John F. Welch Technology Centre in Bangalore, engineers are developing new ideas for aircraft engines, transport systems and plastics." Indeed, GE over the years has frequently transferred Indian engineers who worked for it in the United States back to India to integrate its whole global research effort. GE now even sends non-Indians to Bangalore. Vivek Paul is the president of Wipro Technologies, another of the elite Indian technology companies, but he is based in Silicon Valley to be close to Wipro's American customers. Before coming to Wipro, Paul managed GE's CAT scanner business out of Milwaukee. At the time he had a French colleague who managed GE's power generator business for the scanners out of France.
"I ran into him on an airplane recently," said Paul, "and he told me he had moved to India to head up GE's high-energy research there."
I told Vivek that I love hearing an Indian who used to head up GE's CT business in Milwaukee but now runs Wipro's consulting business in Silicon Valley tell me about his former French colleague who has moved to Bangalore to work for GE. That is a flat world.
According to the passage, which of the following is correct:
Solution
The passage mentions that these countries are steadily developing their research and development capabilities to handle more and more of these phases. "As that continues, we really will see the beginning of what Satyam Cherukuri, of Sarnoff, an American research and development firm, has called "the globalization of innovation" and an end to the old model of a single American or European multinational handling all the elements of the product development cycle from its own resources. More and more American and European companies are outsourcing significant research and development tasks to India, Russia, and China."
This aligns mostly with Option B.
Option A is incorrect because the passage does not suggest that outsourcing is happening due to the incapability of these countries to handle other aspects of the product cycle.
Option C is incorrect because the passage does not suggest that American or European multinationals are unable to handle all the elements of the product development cycle. Instead, it suggests a shift in the model where tasks are being outsourced to leverage global talent.
Option D is is incorrect because the passage does not suggest that the development of capabilities in these countries would deter American or European multinationals from handling all elements of the product development cycle.
According to the passage, which of the following is correct:
Solution
The passage mentions that when the author asked his daughter Orly, “Where are cars made?”, she answered, “Japan.” The author’s reaction of “Ouch!” suggests that this was not the answer he had expected. Therefore Option C is the correct answer.
Option A is incorrect. The passage mentions that the U.S. executive greeted Mr. Rao with “Namaste,” a common Hindi greeting, indicating that the call was not ignored.
Option B is incorrect. The passage does not provide information on whether Americans knew or did not know how to say hello in Hindi in the past.
Option D is incorrect. The author speculates about a future where his hypothetical granddaughter might associate software with India, but he does not express a wish for this to happen. He actually says, “No, not yet, honey,” indicating that he doesn’t believe this is currently the case.
With reference to passage. 'That is a flat world' can be best described to mean:
Solution
The author uses the term “flat world” to describe a global environment where opportunities and resources are becoming more evenly distributed and accessible, regardless of geography. This is largely due to advancements in technology and communication, which allow for collaboration and competition on a global scale. So, it’s a metaphor for a world where geographical boundaries are becoming less relevant in business. Therefore, Option B is the correct answer.
Options A,C and D are incorrect
The central idea of the passage is:
Solution
The passage discusses the shift in the global business landscape, where geographical boundaries are becoming less relevant. It talks about how countries like India, China, and Russia are developing their capabilities and how American and European companies are outsourcing significant research and development tasks to these countries. This represents a convergence of technological and other forces that allow businesses to connect and collaborate irrespective of geography, enabling them to reach farther, faster, and deeper than ever before which is mentioned in Option B.
Options A, C and D are either incorrect or distorted.
For the following questions answer them individually
Match the word with its correct meaning:

Solution
Flotsam (i) matches with People or things that have been rejected or discarded as worthless (e). The term “Flotsam” is used to describe debris in the water that was not deliberately thrown overboard, often resulting from a shipwreck or accident. This can include parts of a ship, its equipment, cargo, and anything else that floats. However, the term has been metaphorically extended to refer to people or things that have been rejected or discarded as worthless.
Coterie (ii) matches with People with common interest who do things together in small group and do not like to include others (a). A coterie is a small group of people with shared interests or tastes, excluding others.
Insouciant (iii) matches with Showing a casual lack of concern (d). Insouciant means showing a casual lack of concern; indifferent.
Effrontery (iv) matches with Insolent or impertinent behaviour (b). Effrontery is insolent or impertinent behaviour; it’s being bold and disrespectful.
Phlegmatic (v) matches with Not easily made angry or upset (c). Phlegmatic refers to having an unemotional and stolidly calm disposition.
For the given idiom, identify the correct meaning
Bring someone to book
Solution
The correct meaning for the idiom “Bring someone to book” is Option A
This idiom is used when someone is made to face punishment or is held accountable for their actions. It’s often used in the context of formal systems like law, school, or work, where there are clear rules and consequences for breaking them. The phrase suggests that the person’s actions are being recorded in a ‘book’ or record, and they are being called to answer for them. It does not literally involve a book. The ‘book’ in the phrase is metaphorical, referring to the recording or noting down of someone’s wrong actions.
Irons in the fire
Solution
Irons in the fire means to be involved with many activities or jobs at the same time.
Option D is closest to this and, hence, would be the correct answer.
Fish out of water
Solution
Fish out of water refers to an individual feeling awkward or anxious because they are in a situation that is not familiar.
Option B is closest to this and, hence, is the correct answer.
For the following questions answer them individually
Fill in the blanks with appropriate words to form a meaningful paragraph:
Conflict is a great clarifier; in a conflict, the opposing ____________ not only come to a better understanding of each other s arguments but are forced to reflect on the _____________ and clarity of their own beliefs. Conflict prevent one from becoming ______________ into thinking that there is only one truth. It also serves as a powerful antidote against intellectual sterility and decline. since it encourages the _______________ adjustment and refinement of competing positions.
Solution
Looking at the options available for the first blank, we can eliminate option C since 'opposing ally' is an oxymoron and would not fit.
While filling the second blank, we should look for a positive term to complement 'clarity'. Thus, we can eliminate options B and D, as both are negative and wouldn't fit in the second blank.
This leaves us with only option A. By using the third and fourth words from option A, we see that they fit in the third and fourth blanks.
Therefore, option A is the correct answer.
For the meaning give in the question, choose the most appropriate and expressive adjective from the options:
Meaning: form of long-standing habit; long-accustomed, deeply habituated
Solution
Inveterate is an adjective referring to having a particular habit, activity, or trait that is long-established and unlikely to change.
Notorious means well-known for something bad or an unfavorable quality, deed, etc.; infamous.
Congenital is an adjective used to refer to a trait or abnormality present from birth.
Glib is an adjective used to refer to the words of a speaker, fluent but insincere and shallow.
Therefore, Option A is the correct answer.
Meaning: outstanding bad or vicious
Solution
Salubrious is an adjective used for health-giving or healthy.
Chronic is an adjective used for something persisting for a long period of time.
Egregious is an adjective used for something outstandingly bad or shocking.
Opprobrious is an adjective used for expressing scorn, disgrace, or contempt.
Option C is the correct answer.
For the given root/suffix, identify its meaning:
Suffix: '-escent' as used in the context of word 'senescent'
Solution
Senescent refers to the process of growing old, ageing, or becoming elderly.
The form '-escent' comes from the Latin participle-forming suffix '—ēscēns', which roughly means 'becoming.'
Of all the given options, Option D would best explain the meaning of 'escent' in the word 'senescent.'
Therefore, Option D would be the correct answer.
Root: 'agogos' as used in the context of word 'demagogue'
Solution
A demagogue is a political leader who seeks support by appealing to the desires and prejudices of ordinary people rather than by using rational arguments.
The form '-agogue' comes from the Greek '-agōgos', meaning 'leading.'
Of all the given options, Option B would best explain the meaning of 'agogos' in the word 'demagogue'.
Therefore, Option B is the correct answer.
Identify the Antonym for the given word:
VENAL
Solution
"Venal" means capable of being bought or influenced by money or other valuable considerations.
"Avaricious" means having extreme greed for wealth or monetary gains.
"Mercenary" refers to professional individuals who join armed conflicts for their own profit.
"Untrustworthy" is an adjective describing someone negatively.
"Incorruptible," on the other hand, is an adjective used to describe someone or something not subject to corruption or bribery.
Of all the given options, "incorruptible" serves best as an antonym for "venal."
Therefore, Option D is the correct answer.
LACONIC
Solution
"Laconic" is an adjective used to describe someone or something using a few words.
"Compendious," "aphoristic," and "apothegmatic" mean stating facts or information in a concise manner. "Pleonastic," on the other hand, means the repetition of the same sense in different words, like the phrase "a true fact."
Of all the given options, "pleonastic" would best fit as an antonym for "laconic."
Therefore, Option C is the correct answer.
For the following questions answer them individually
Identify the misspelled word:
Solution
The correct answer is Option A as the correct spelling is Iniquitous, which means grossly unfair and morally wrong.
Identify the option to which the collective noun given in the question does not apply:
Collective Noun: shoal
Solution
The collective noun 'shoal' is used to describe a group of species that swim together. Options A,B and C are types of fish whereas gnats are a type of insects. So, Option D is the correct answer.
Collective Noun: herd
Solution
The collective noun 'herd' is used to describe a group of grazing animals like sheep and cattle. Gulls are a type of seabird, which is why it is the odd ones out.
Option A: Chamois are a type of goat-antelope that live in mountainous regions. Since they are grazing animals, they are correctly referred to as a herd.
Option C: While walruses are marine mammals, they are often referred to as a herd when grouped together on land or ice.
Option D: Wrens are small birds. The correct collective nouns for wrens include a "flock" or a "chime", not a "herd."
Identify one word for the description given in question:
A state whose power derives from its baval or commercial supremacy on the seas.
Solution
A thalassocracy or thalattocracy, sometimes also maritime empire, is a state with primarily maritime realms, an empire at sea, or a seaborne empire.
One who possesses outstanding technical ability in a particular art or field.
Solution
A virtuoso is an individual who possesses outstanding talent and technical ability in a particular art or field such as fine arts, music, singing, playing a musical instrument, or composition.
Use the words in the table below to solve the questions:

Complete the crossword using the words from above table. There are more words in the table than required.
Down:
3.A Situation that is complicated, confusing or embarrassing, especially a political or public one:
8. (used about a thing or person) old and in very bad condition or poor health
Across:
A ·That cause a fire:
7. Persuade ( Someone) to do something by means of deception or flattery:

Solution
An imbroglio is an extremely confused, complicated, or embarrassing situation. So, for 3 down, xv is the answer.
A decrepit is someone or something that is worn out or ruined because of age or neglect. So, the answer for 8 down is iv.
An incendiary is designed to cause fires. So, the correct answer for 2 across is vii.
To inveigle is to persuade (someone) to do something by means of deception or flattery. So, the correct answer for 7 across is viii.
The question has explained the meaning of two words from the given table. Identify the correct matching words from the table.

a) A story or play about a murderer in which the identity of the murder is not revealed until the end
b) able or fit to fly
Solution
A whodunit is a mystery story that keeps the criminal's identity a secret until the very end.
Volacious means able or fit to fly.
Six friends - Parul, Sumedha, Smita, Cheena, Isha, and Atharv: are playing Coin-Flip game. The person who gets 'Head' wins the game and if both persons get /Head' or both get 'Tail' the game ends in a Draw. Each toss ended as a 'Win (W)' or a 'Loss (L)' or a Draw (D). The game started at 09:00 AM with three tosses between the six friends. The other time slot at which the toss was done was at 09:15 AM, 09:30 AM, 09:45 AM and 10:00 AM. At each time slot, three tosses were held with each person playing exactly one toss at each time slot. Each person plays ·with the other person only once.
The results of the game are given in the order in which each person played the Coin-Flip game (from left to right).

Which of the following correctly represents the list of friends that Cheena beat?
Solution
From the given information, we get the following table.

In round 5, there is only one winner and one loser. Hence Smita & Atharv must play against each other.
In rounds 2,3 &4, there is one draw each. Hence those players must play against each other in their respective rounds.
From the above conclusions, we get the following table.

In round 1, Atharv cannot play against Cheena as both of them are winners. Hence, he plays against Sumedha in round 1 & against Cheena in round 4.

In round 4, only Smita & Parul are left. So they play against each other.
Then In round 3, Sumedha & Smita and Parul & Cheena will play against each other, respectively.
As Sumedha played against Smita in round 3, she will play against Cheena in round 2.
Then Isha plays against Smita in round 2.

Smita played against everyone except Cheena. Hence, she plays against Cheena in round 1.
Then Parul must have played against Isha in round 1.

Sumedha played against everyone except Parul. Hence she plays against Parul in round 5.
Cheena played against Isha in round 5.
Hence, The final arrangement is

1A) Cheena won in rounds 1 & 4. In those rounds, she played against Smita & Atharv.
Option (B) is correct.
At what time, the game was played between Smita and Parul?
Solution
From the given information, we get the following table.
In round 5, there is only one winner and one loser. Hence Smita & Atharv must play against each other.
In rounds 2,3 &4, there is one draw each. Hence those players must play against each other in their respective rounds.
From the above conclusions, we get the following table.
In round 1, Atharv cannot play against Cheena as both of them are winners. Hence, he plays against Sumedha in round 1 & against Cheena in round 4.
In round 4, only Smita & Parul are left. So they play against each other.
Then In round 3, Sumedha & Smita and Parul & Cheena will play against each other, respectively.
As Sumedha played against Smita in round 3, she will play against Cheena in round 2.
Then Isha plays against Smita in round 2.
Smita played against everyone except Cheena. Hence, she plays against Cheena in round 1.
Then Parul must have played against Isha in round 1.
Sumedha played against everyone except Parul. Hence she plays against Parul in round 5.
Cheena played against Isha in round 5.
Hence, The final arrangement is
The game between Smita & Parul played in round 4, i.e 9:45 AM.
Option (D) is correct.
Which of the following is/are result that did not happen in the game?
1. Parul won against Isha at 09:00 AM
2. Smita lost against Sumedha at 09:30 AM
3. Cheena won against Isha at 09:45 AM
4. Atharva lost against Smita at 10:00 AM
Solution
From the given information, we get the following table.
In round 5, there is only one winner and one loser. Hence Smita & Atharv must play against each other.
In rounds 2,3 &4, there is one draw each. Hence those players must play against each other in their respective rounds.
From the above conclusions, we get the following table.
In round 1, Atharv cannot play against Cheena as both of them are winners. Hence, he plays against Sumedha in round 1 & against Cheena in round 4.
In round 4, only Smita & Parul are left. So they play against each other.
Then In round 3, Sumedha & Smita and Parul & Cheena will play against each other, respectively.
As Sumedha played against Smita in round 3, she will play against Cheena in round 2.
Then Isha plays against Smita in round 2.
Smita played against everyone except Cheena. Hence, she plays against Cheena in round 1.
Then Parul must have played against Isha in round 1.
Sumedha played against everyone except Parul. Hence she plays against Parul in round 5.
Cheena played against Isha in round 5.
Hence, The final arrangement is
Option (1) True. Parul won against Isha at 09:00 AM in round 1.
Option (2) True. Smita lost against Sumedha at 09:30 AM in round 3.
Option (3) False. Cheena won against Atharv at 09:45 AM in round 4.
Option (4) True. Atharv lost against Smita at 10:00 AM in round 5.
How many matches did Smita lose before she played with Sumedha?
Solution
From the given information, we get the following table.
In round 5, there is only one winner and one loser. Hence Smita & Atharv must play against each other.
In rounds 2,3 &4, there is one draw each. Hence those players must play against each other in their respective rounds.
From the above conclusions, we get the following table.
In round 1, Atharv cannot play against Cheena as both of them are winners. Hence, he plays against Sumedha in round 1 & against Cheena in round 4.
In round 4, only Smita & Parul are left. So they play against each other.
Then In round 3, Sumedha & Smita and Parul & Cheena will play against each other, respectively.
As Sumedha played against Smita in round 3, she will play against Cheena in round 2.
Then Isha plays against Smita in round 2.
Smita played against everyone except Cheena. Hence, she plays against Cheena in round 1.
Then Parul must have played against Isha in round 1.
Sumedha played against everyone except Parul. Hence she plays against Parul in round 5.
Cheena played against Isha in round 5.
Hence, The final arrangement is
Smita played against Sumedha in round 3. Before round 3, Smita lost in rounds 1 & 2, i.e. 2 games.
Option (A) is the answer.
WHO member countries - A, B, C, D and E meet for a round table discussion to explore the future of COVID-19 pandemic and other infectious threats. Out of these five countries, three are developed countries and two are developing countries. The following information is given:
I. The two developing countries will not be seated next to each other
II. The country A, which is a developed country, will always take a seat as far as possible from country B
III. The country D will always be seated next to a developing country
If country C is a developed country. Which of the following is definitely not true.
Solution
Out of A, B, C, D & E, three are developed countries, and two are developing countries.
a) Country A is a developed country.
b) It is given that no two developing countries will sit next to each other and country D will always be seated next to a developing country.
Hence country D is a developed country.
c) It is given in the question that 'C' is also a developed country. Hence 'B' and 'E' are developing countries.
Country A will always take a seat as far as possible from country B. Two arrangements are possible.

No two developing countries will sit next to each other. Hence, 'E' can take only one position.

Countries 'C' and 'D' can take either of the positions.

Option (A) is True.
Option (B) is True.
Option (C) is True.
Option (D) is False.
Hence Option (D) is the answer.
If country D always has a developing country to its right in how many different arrangements can country B be a developing country?
Solution
Out of A, B, C, D & E, three are developed countries, and two are developing countries.
a) Country A is a developed country.
b) The country A which is a developed country. will always take a seat a far as possible from country B

These are the two possible positions.
c) It is given that no two developing countries will sit next to each other and country D will always be seated next to a developing country.
Hence country D is a developed country.
It is given in the question that 'D' has a developing country to its right.
So, two 'B', 'C' and 'E' are developing countries.
Now, what can be the possible positions of D.
There are 4 possible positions for D.
.png)
Of these positions only at 3, 4 D has B to it right. So, The answer is 2.
If country E is sitting to the immediate right of country A, which of the following statements is/ are definitely true?
1. Country B and Country D sit next to each other
2. Country C has to be a developing country
3. Country E has to be a developed country
Solution
Given A and B are as far as possible. And also E is sitting right to A. With this information there are 2 arrangements.
.png)
.png)
Now we have to arrange C, D in those two positions.
.png)
The Principal of Harvard College is allocating office cabins to seven PhD students, namely, John, Jame ., Mary. Michael, Richard, Franka and Tom. The cabins of these students are arranged in a row (left $$\rightarrow$$ right).
Tom is working on a project with Richard, and they receive phone calls regularly for the project work. Tom is always seated to the left of Richard. Mary is the Class Representative and is allotted the largest space which is cabin number 3. John and James sit together as they are working on the same assignment and are required to discuss regularly. Richard, John, Michael and Tom like to read books. Mary does not like to read books, and the cabin next to her should be occupied by a non-reader. Michael is not allocated the extreme cabin.
Which of the following student would occupy the cabin farthest from Mary.
Solution
From the given information,
1) Tom will sit on the left of Richard.
2) John and Jame will sit together.
3) Michael is not in extreme cabins.
4) John, Michael, Richard and Tom are readers.
5) Jame, Mary and Franka are non-readers.
6) Mary is in the third cabin, and as she doesn't like reading, on both sides of her cabin, non-readers must be seated.

It is given that Michael is not in extreme cabins. Hence he must take the fifth or sixth cabin.
Case (1):- Michael is in the sixth cabin.

In this configuration, Tom and Richard cannot sit together. Hence this case is not possible.
Case (2):- Michael is in the fifth cabin.

Tom and Richard can take the sixth and seventh cabins only.

Since Jane and John have to sit together. Jane can only take the second cabin. Hence Franka will take the third cabin.

Therefore the farthest person from Mary is Richard.
Option (D) is correct.
Which of the following would be the cabin occupied by Michael?
Solution
From the given information,
1) Tom will sit on the left of Richard.
2) John and Jame will sit together.
3) Michael is not in extreme cabins.
4) John, Michael, Richard and Tom are readers.
5) Jame, Mary and Franka are non-readers.
6) Mary is in the third cabin, and as she doesn't like reading, on both sides of her cabin, non-readers must be seated.
It is given that Michael is not in extreme cabins. Hence he must take the fifth or sixth cabin.
Case (1):- Michael is in the sixth cabin.
In this configuration, Tom and Richard cannot sit together. Hence this case is not possible.
Case (2):- Michael is in the fifth cabin.
Tom and Richard can take the sixth and seventh cabins only.
Since Jane and John have to sit together. Jane can only take the second cabin. Hence Franka will take the third cabin.
Therefore Michael occupies the fifth cabin.
Option (C) is correct.
A company has decided to start a transport service. The company will be operating its service from eight different locations which connect each location directly. The travel duration between any two locations will be less than two hours. The company has to decide on the location based on the commuter daily schedules. The person staying in any of these eight locations should be able to commute to any other location in the morning and should be able to return by evening on the same day.
The travel between any two locations can be done using only direct transport. i.e .. say using direct bus service, then the minimum number of direct buses to be scheduled are?
Solution
Let's name the 8 locations as L1, L2, L3, L4, L5, L6, L7, L8.
From each of the 8 locations, we will have a bus to all the other seven locations in the morning. So, there will be 8*7=56 buses scheduled in the morning.
Also, we will have the same number of buses scheduled in the evening. So, another 56 buses have to be scheduled.
The total number of buses is 56+56=112.
Suppose two of the eight locations are planned to be designated as core location. A core location is a location which is connected with every other location by direct bus each way, both in the morning as well as in the evening. The only direct bus which will be scheduled are originating in or terminating in one of the core location. Then, the minimum number of direct buses that need to be planned so that company is able to serve all the eight locations without visiting more than one core location during one trip are ... ?
Solution
Let's name the 8 locations as L1, L2, L3, L4, L5, L6, L7, L8.
Given there are two core locations, from each of the core location there has to be a bus to 7 other location.
Also, there has to be a bus from the other locations to the core location. So, for the first core location there are 7*2=14.
Similarly, for the second core location there has to be 14 buses. But this includes bus from first core location to second core location and bus form second core location to first core location. These two are already counted in the first. So, there will be 12 additional buses for the second location.
This is all for the morning. The same number of buses will be there for the evening. So, the total number of buses will be 2*(14+12)=2*26=52
For the following questions answer them individually
The director of an institute ha to choose four student out of eight students for a trip to Mumbai. The director decided to choose these four students in such a manner that each selected student has a common interest with at least one of the other student chosen for the trip.
The elected student must also di like at least one of the interest of the other students.
Student A has interest in reading and playing football but dislikes shopping
Student B has interest in playing football and cricket but dislikes reading
Student C has interest in hopping but dislike to play football
Student D has interet in watching movies and dislikes to play cricket
Student E has interest in playing cricket but dislikes to play football and watch moYies
Student F has interest in reading books but dislikes to play football and watch movies
Student G has interest in hopping and watching movies, but dislikes to read books
Student H has interest in playing football and shopping but dislikes movies
Who are the four students chosen by the director for the trip.
Solution
From the given information, we get following table

In the annual cultural festival of a university, a quiz competition was conducted, wherein all participants were given three rounds with two questions in each round. In the first round, the participants get 40 points for each correct answer and a penalty of 20 points for each incorrect answer. If the participant answers both questions correctly, a bonus of 20 points is given. In the second round, the participant gets the same points as in the first round. Additionally, if both questions are incorrect, an additional penalty of 20 points is imposed. In the last round, the participant gets 80 points for each correct answer and a penalty of 40 points for each incorrect answer.
If only two answers are incorrect in the ,whole quiz, the minimum possible score is:
Solution
From the given information, we get the following table,

In the third round, the negative mark for the incorrect answer is high.
Hence to get the minimum possible score, the two incorrect answers must be from round 3.

For all other cases, the minimum score will be greater than 120.
examples,
1)

2)

Therefore the minimum possible score is 120.
Option (A) is correct.
If only two an answers are correct in the whole quiz, what is the probability that score would be 40?
Solution
From the given information, we get the following table,

Only two answers are correct in the whole quiz. We can select only two correct answers in the following ways.


In any configuration total score is not equal to 40.
Therefore the probability is '0'.
Option (D) is correct.
Figure 1 depicts the percentage of the total number of male and female athletes from the given five countries: Australia, Brazil, Canada, China, and Italy who participated in the Tokyo Olympics in the year 021.
The total number of athletes who participated from the given five countries is 32400

In Figure 2, the percentage of the number of female athletes from the same five countries who participated in the Tokyo Olympics in the year 2021 are given as under:

If the total number of female athletes who participated in 2021 Olympics from the given five countries were 15000, then how many countries had the number of male athletes less than the number of female athletes?
Solution
It is given that the total number of athletes who participated from the given five countries is 32400.
From figure 1, we can easily find the total number of athletes for each of the five countries.
Let the number of total female athletes from these five countries be 100x. Then we will get this table:

In the question, it's given that the total number of female athletes who participated in 2021 Olympics from the given five countries were 15000.
Hence, 100x = 15000 => x = 150
Hence, we get this following table:

From the table, we can see that 3 countries (Canada, China, and Italy) had the number of male athletes less than the number of female athletes.
The correct option is B
If the average number of male athletes from all the given five countries 4000, then what was the average number of female athletes from Italy and Canada?
Solution
It is given that the total number of athletes who participated from the given five countries is 32400.
From figure 1, we can easily find the total number of athletes for each of the five countries.
Let the number of total female athletes from these five countries be 100x. Then we will get this table:
In the question, it's given that the average number of male athletes from all the given five countries 4000, which implies the total number of male athletes = (4000*5) = 20000
Hence, the number of total female athletes from these five countries = (32400 - 20000) = 12400
=> 100x = 12400 => x = 124
the average number of female athletes from Italy and Canada is (25x+14x)/2 = 19.5x =19.5 * 124 = 2418
The correct option is D
In the 2021 Olympics, if the proportion of male athletes to female athletes from Canada was 31:50, what would be the corresponding ratio for male to female athletes for China in the same year?
Solution
It is given that the total number of athletes who participated from the given five countries is 32400.
From figure 1, we can easily find the total number of athletes for each of the five countries.
Let the number of total female athletes from these five countries be 100x. Then we will get this table:
In the question, it's given that the proportion of male athletes to female athletes from Canada was 31:50.
Let the number of male athletes from Canada be 31y, which implies the number of female athletes from Canada is 50y. The total number of athletes from Canada is 81y, which is equal to 4860
=> 81y = 4860 => y = 60. Therefore, the number of female athletes from Canada is (50*60) = 3000, which is 25% of the total female athletes (Fig 2).
Hence, the total number of female athletes = 3000*(100/25) = 12000. Hence, 100x = 12000 => x = 120
The following table is given below:

Hence, the ratio for male to female athletes for China in the same year is 360:288, which can be simplified as 5: 4
The correct option is C
If the total number of female athletes who participated from the given five countries were 18000, then what is the ratio of the number of female athlete from Canada to the total number of athletes from Brazil .
Solution
It is given that the total number of athletes who participated from the given five countries is 32400.
From figure 1, we can easily find the total number of athletes for each of the five countries.
Let the number of total female athletes from these five countries be 100x. Then we will get this table:
It is given that the total number of female athletes who participated from the given five countries were 18000.
=> 100x = 18000 => x = 180
The following table is given below:

From the table, we can see that the ratio of the number of female athlete from Canada to the total number of athletes from Brazil is 45: 81, which can be simplified into 5:9
The correct option is A
Figure 3 depicts the pie chart indicating the percentage distribution of per unit steel price over the period of eight years from 2005 to 2012. The average per unit price of steel from 2005 to 2012 = Rs. 11. (Absolute per unit steel prices can be rounded off to nearest integer value).

Figure 4 depicts the revenue & profit of a steel manufacturing company respectively. There is no fixed cost component and all units of steel produced is sold in the same year.

Answer the questions given below:
In which of the follmowing year, the cost per unit of steel is the highest?
Solution
Figure 3 depicts the pie chart indicating the percentage distribution of per unit steel price over the period of eight years from 2005 to 2012.
The pie graph shows the percentages of unit steel prices over the eight years from 2005 to 2012.
So, in 2006 it was 15.91%; in 2008, it was 13.64%; in 2009, it was 9.09%; and in 2011 it was 13.64%.
=> The prices across the 4 years will be 15.91x, 13.64x, 9.09x, and 13.64x
=> The cost per unit of steel was the highest in 2006.
What is the approximate avernge number of unit of steel being sold during 2005 to 2012.
Solution
First, we need to find the prices of units of steel from 2005 to 2012. 88 is the sum of prices, and 11 is the average across 8 years.
In 2005, it is equal to 11.36/100 * 88 = 10.
Similarly, calculating for other years, we get:
The prices of steel for 2005 - 12 are 10, 14, 12, 12, 8, 10, 14, 8, respectively in each year, and the revenues are 1000, 1600, 1200, 1400, 800, 800, 1200, 1100.
=> The number of pieces produced each year is 1000/10, 1600/14, 1200/12, 1400/12, 800/8, 800/10, 1200/14, 1100/8
=> The average of all the above 8 quantities = 104.27, which is approx 104.
What is the ratio of lowest and highest per unit price of steel from 2005 to 2012?
Solution
First, we need to find the prices of units of steel from 2005 to 2012. 88 is the sum of prices, and 11 is the average across 8 years.
In 2005, it is equal to 11.36/100 * 88 = 10.
Similarly, calculating for other years, we get:
The steel prices for 2005 - 12 are
2005 = 10
2006 = 14
2007 = 12
2008 = 12
2009 = 8
2010 = 10
2011 =14
2012 = 8
The lowest and highest per unit price of steel is 8 and 14
The required ratio is 8 : 14 = 4: 7.
If in 2013 revenue has increased by 25 percent, profit has decreased by 25 percent and per unit steel price has increaed by 10 percent as compared to that in 2012. What is the approximate quantity of steel being sold in 2013?
Solution
First, we need to find the prices of units of steel from 2005 to 2012. 88 is the sum of prices, and 11 is the average across 8 years.
In 2005, it is equal to 11.36/100 * 88 = 10.
Similarly, calculating for other years, we get:
The steel prices for 2005 - 12 are 10, 14, 12, 12, 8, 10, 14, 8, respectively, and the revenues are 1000, 1600, 1200, 1400, 800, 800, 1200, 1100.
In 2013, the revenue increased by 25% => New revenue = 1100 * 1.25 = 1375.
The price increased by 10% => 8 * 1.1 = 8.8
=> The required quantity = Revenue / per unit price = 1375 / 8.8 = 156.25.
Analyse the following bar chart (Figure 5) and answer the questions given below:
The stacked bar-chart gives the distribution of the budget expenditure (percentage allocation) of six states namely: Punjab, Haryana, Gujarat, Madhya Pradesh, Uttar Pradesh and Bihar for year 2000. The budget expenditure is allocated for following six sectors:
Electricity, Roads, Dairy, Agriculture, Industry and Health.
The absolute allocation of budget of each state per sector is in Rs. thousand crores and it can take any one value out of the following: 40, 50, 60, 70, 80 and 90 (Rs. thousand crores). (All the percentages shown in the following graph are rounded-off to the nearest two decimal points).

Which state of India allocated the second highest total expenditure in all the six sectors combined?
In which sector, at least two states allocated exactly Rs. 70 thousand crores?
Which of the following was not the total allocation of any of the six statca (in thousand crores)?
In which sector, the sum of the allocation by the six states taken together was the third highest?
With the spread of Covid-19 in 2020, it was mandated by Public Health Authorities that each patient admitted in the hospital has to undergo Covid-19 test. In the context of this information, study the table a under and answer the given questions.
Table 1: Number of patients admitted and found COVID-19 positive in a district hospital in 2021

In July 2021, if the number of Covid-19 positive female patients was 194, what was the respective ratio of number of admitted Covid-19 positive male patients and number of admitted Covid-19 positive female patients?
Solution
Total number of patients admitted in July 2021 = 1000
The number of covid positive patients = 64% of total patients
= 64% of 1000 = 640 patients.
Out of 640, 194 are female covid positive patients.
The number of male covid positive patients = 640 - 194 = 446 patients.
The ratio of the number of admitted Covid-19-positive male patients and the number of admitted Covid-19 positive female patients = $$\frac{446}{194}=\frac{223}{97}$$
Option (C) is the answer.
If the number of admitted patients increased by 40 percent from March to August 2021 and also, 25 percent of the admitted patients were found Covid-19 positive in August 2021, what was the number of Covid-19 positive patients in August 2021?
Solution
The number of admitted patients in March 2021 = 900
By August 2021, the number of admitted patients are increased by 40% from March 2021
= $$(100+40)\%\times\ 900$$
= $$(1.4)\ \times\ 900$$ = $$1260$$
Out of 1260 admitted patients, 25% are covid positive.
Hence the number of covid positive patients are =$$(25)\%\times\ 1260$$
=$$\frac{25}{100}\times\ 1260$$
$$\frac{1}{4}\times\ 1260=315$$ Patients.
Option (D) is correct.
In April 2021, if the respective ratio of the number of admitted patients to the number of patients found Covid-19 positive was 5:4: then the number of female Covid-19 positive patients constitute what percent of the number of admitted patients in April 2021?
Solution
Let the number of admitted patients in April 2021 be $$5x$$
and the number of patients found Covid-19 positive was be $$4x$$.
From the table, in April 2021 the ratio of the number of covid positive male patients to covid positive female patients is
given as 5:3.
The number of covid positive female patients in April 2021 = $$\frac{3}{3+5}\times\ $$ total covid positive patients
= $$\frac{3}{3+5}\times\ 4x$$ = $$\frac{3}{8}\times\ 4x\ =\ \frac{3x}{2}$$.
Hence, the percentage of the number of covid positive female patients in the number of admitted patients =
= $$\ \frac{3x}{2\ \times\ 5x}\times\ 100$$ = $$\ 30$$
Option (A) is correct.
In June 2021, if the difference between the number of male Covid-19 positive patients and female Covid-19 positive patients was 72. What was the number of admitted patient in June 2021?
Solution
It is given that the ratio of number of male covid positive patients to female covid patients = 9:5
Let the number of male covid positive patients be '$$9x$$' and female covid positive patients be $$5x$$
The difference between number of male and female covid positive patients = 72
$$9x-5x=72$$
$$4x=72$$
$$x=18$$
Hence the total number of covid positive patients = $$9x+5x=14x=14\times\ 18=252$$
From the table, the total number of covid positive patients is 42% of the total admitted patients.
Let the total number of admitted patients be $$y$$
Then, the total number of covid positive patients = 42% of $$y$$
$$0.42y=252$$
$$y=600\ $$
Therefore the total number of admitted patients is 600.
Option (D) is correct.
For the following questions answer them individually
The headquaters of International Atomic Energy Agency (IAFA) is located at........
Birr is the currency of which country?
From the logos given below. identify the one that is not a multinational retail company
which group of states hosted the Durand Cup 2022?
: Nikhat Zareen is a o iated with whi h of the following sport?
India has become the ____________ largesst economy (National GDP) in September, 2022 as per International Monetary Fund(IMF)
Bayraktar TB2 drone is developed in which of the following country?
Which of the following statement about India's first indigenous Aircraft Carrier "Vikrant" is not correct?
Which of the following statement about the Indo-Pacific Economic Framework for Prosperity (IPEF) is not true?
Given a m1der are the name of book and the 'author'.

Based on above, answer the right option.
Given as under are the name of an automobile manufacturer and its product name.

Based on above, answer the right option.
Given under are dates and days celebrated as an impo1tant clay declared by UN.

Based on the above answer the right option.
Which of the following is not a crypto-currency exchange?
Which of the following city hosted G-20 Summit (Head of States) in November 2022?
Nusantara will become the capital of which of the following country?
Which of the following is the first country in the world to buy India's Supersonic 'BrahMos" missile?
Who among the following received Dada Saheb Phalke award in theyear?
Which of the following is not a maritime chokepint in internationa logistics and shipping?
Match the following:

Match the following:


