Instructions
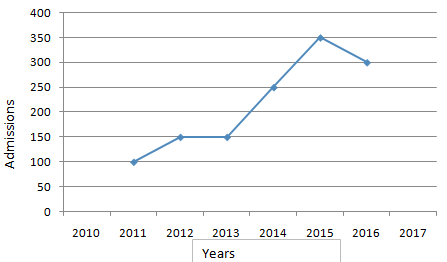
The line graph shows the record of number of admissions to a certain coaching center from 2011 to 2016. Study the diagram and answer the following questions.
Question 99
Admissions in the year 2014 grew by _______ percent as compared to the previous year.
Solution
Admissions in 2013 = 150
Admissions in 2014 = 250
=> Required % increase = $$\frac{250-150}{150} \times 100$$
= $$\frac{2}{3} \times 100=66.67\%$$
=> Ans - (D)
Get AI Help
Create a FREE account and get:
- Free SSC Study Material - 18000 Questions
- 230+ SSC previous papers with solutions PDF
- 100+ SSC Online Tests for Free


