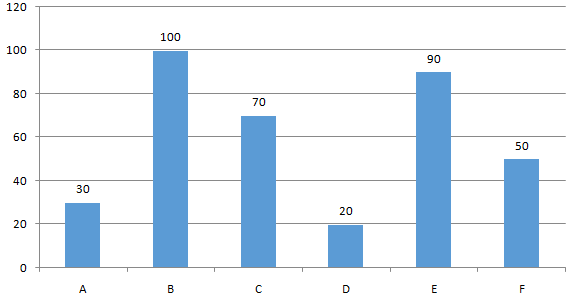
The bar graph shows GDP for the year 2016 In billion USD of six countries (A, B, C, D, E, F) of a regional trade block. Study the diagram and answer the following questions.

country
Solution
Countries B and E are respectively the highest and second highest in terms of Gross Domestic Product (GDP).
Thus, country C with 70 billion USD is the third highest in terms of Gross Domestic Product (GDP).
=> Ans - (B)
Create a FREE account and get:
- Free SSC Study Material - 18000 Questions
- 230+ SSC previous papers with solutions PDF
- 100+ SSC Online Tests for Free

