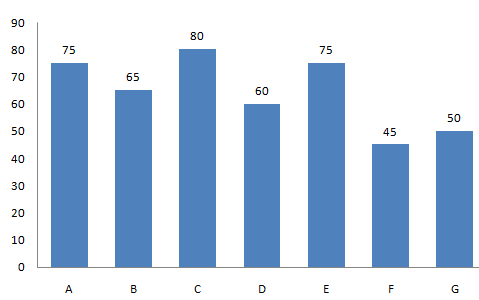
The bar graph shows average marks scored in a 100 marks Science exam by students of 7 divisions of Standard X. Study the diagram and answer the following questions.
Average Science Marks

Division
Solution
Marks when arranged in ascending order are : $$45<50<60<65<75,75<80$$
Corresponding division is : $$F,G,D,B,A,E,C$$
Thus, G division scored second lowest marks.
=> Ans - (C)
Video Solution

Click on the Email ☝️ to Watch the Video Solution
Create a FREE account and get:
- Free SSC Study Material - 18000 Questions
- 230+ SSC previous papers with solutions PDF
- 100+ SSC Online Tests for Free

