Instructions
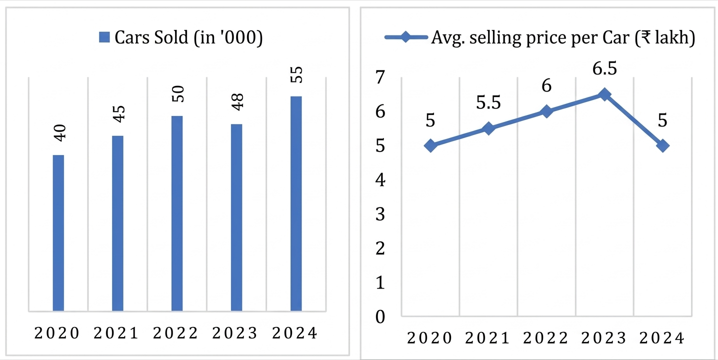
Auto-Grow Ltd., an automobile manufacturing company, tracks its annual car sales (in thousand units) and average selling price per car (in ₹ lakh) over a period of five consecutive years from 2020 to 2024. The company uses a mixed graph where the bar chart represents the number of cars sold and the line graph represents the average selling price per car.
Additional information:
The manufacturing cost per car was constant at ₹2 lakh from 2020 to 2022 and increased by10% each year thereafter.
The company incurred fixed operational costs of ₹100 crore per year.
Profit (or loss) for a year = Total revenue − (Total variable cost + Fixed cost).
Ignore taxes and depreciation.


