Sign in
Please select an account to continue using cracku.in
↓ →
Join Our JEE Preparation Group
Prep with like-minded aspirants; Get access to free daily tests and study material.
The graph between two temperature scales P and Q is shown in the figure. Between upper fixed point and lower fixed point there are 150 equal divisions of scale P and 100 divisions on scale Q. The relationship for conversion between the two scales is given by:
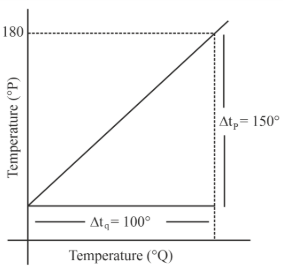
Use the general relation for any linear temperature scales:
$$\frac{\text{Reading}-\text{Lower fixed point}}{\text{Upper fixed point}-\text{Lower fixed point}}=\text{constant}$$
For scale P:
For scale Q:
So,
$$\frac{t_P-30}{180-30}=\frac{t_Q-0}{100-0}$$
$$\frac{t_P-30}{150}=\frac{t_Q}{100}$$
Click on the Email ☝️ to Watch the Video Solution
Create a FREE account and get:


Educational materials for JEE preparation

Ask our AI anything

AI can make mistakes. Please verify important information.
AI can make mistakes. Please verify important information.
