Question 75

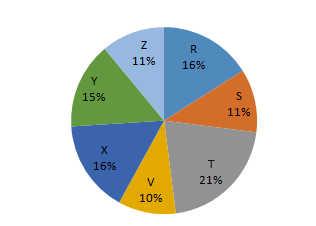
The following pie chart shows proportion of population of seven villages in 2009. Study the pie chart and answer the questions that follows :

In 2010, the population of 'Y' and 'V' increases by 10% each and the percentage of population below poverty line remains unchanged for all the villages. If in 2009, the population of village Y was 30,000, then the below poverty line population of village 'V' in 2010 is _____


Create a FREE account and get:

  • Free SSC Study Material - 18000 Questions
  • 230+ SSC previous papers with solutions PDF
  • 100+ SSC Online Tests for Free

cracku

Boost your Prep!

Download App