Sign in
Please select an account to continue using cracku.in
↓ →
Join Our JEE Preparation Group
Prep with like-minded aspirants; Get access to free daily tests and study material.
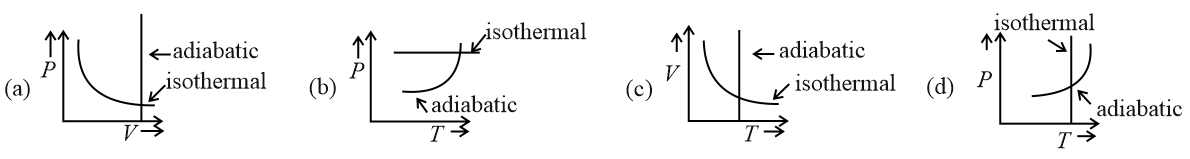
We need to identify the correct graphical representations for two different thermodynamic processes—isothermal and adiabatic—across different state variables ($$P-V$$, $$V-T$$, and $$P-T$$ diagrams).
For an ideal gas undergoing isothermal and adiabatic expansions:
Differentiating both governing equations with respect to volume ($$V$$) gives the slopes of the curves on a pressure-volume graph:
Since $$\gamma > 1$$, the adiabatic curve is steeper than the isothermal curve during expansion. In graph (a), the label pointing to the steeper curve is incorrectly labeled as isothermal, making graph (a) incorrect.
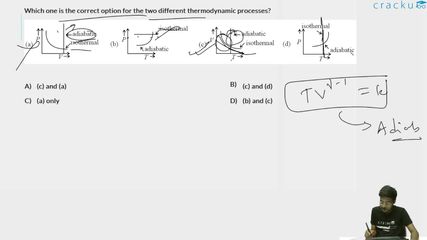
$$T V^{\gamma - 1} = \text{constant}$$
As volume ($$V$$) increases during an expansion, temperature ($$T$$) must decrease. This produces a downward-sloping curve. Graph (c) correctly displays both of these behaviors.$$P^{1-\gamma} T^\gamma = \text{constant} \implies P \propto T^{\frac{\gamma}{\gamma - 1}}$$
Since $$\gamma > 1$$, as temperature ($$T$$) decreases during an expansion, pressure ($$P$$) must also decrease. This forms a curved path dropping toward the origin. Graph (d) correctly displays both of these behaviors.Graphs (c) and (d) accurately represent the characteristics of the isothermal and adiabatic processes under their respective thermodynamic variables.
Correct Answer: (c) and (d)
HENCE ; Option B would be the right answer
Click on the Email ☝️ to Watch the Video Solution
Create a FREE account and get:


Educational materials for JEE preparation

Ask our AI anything

AI can make mistakes. Please verify important information.
AI can make mistakes. Please verify important information.