
Join Our JEE Preparation Group
Prep with like-minded aspirants; Get access to free daily tests and study material.
Sign in
Please select an account to continue using cracku.in
↓ →
Join Our JEE Preparation Group
Prep with like-minded aspirants; Get access to free daily tests and study material.
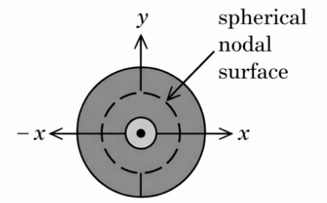
Figure 1. electron probability density for 2s orbital
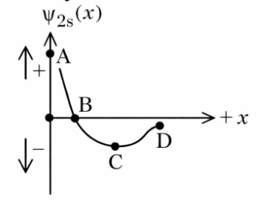
Figure 2. wave function for 2s orbital
Which of the following point in Figure 2 most accurately represents the nodal surface as shown in Figure 1?
The probability density of an electron in an orbital is proportional to $$|\psi|^{2}$$, where $$\psi$$ is the wave function.
For a 2s orbital, the radial part of the wave function $$R_{2s}(r)$$ changes sign once as the distance $$r$$ from the nucleus increases. Hence:
• At the particular radius where $$R_{2s}(r)=0$$, the wave-function crosses the horizontal axis.
• Because $$|\psi|^{2}=0$$ at that same radius, the probability density is also zero there.
• This spherical surface (all points that have that radius) is called a radial node or nodal surface.
Figure 1 shows the electron probability density of the 2s orbital: it starts from zero at the nucleus, rises to a maximum, then falls to zero at the nodal surface, and finally rises and falls again. The radius where the curve touches the horizontal axis in the density plot is the node.
Figure 2 shows the corresponding wave-function plot. On this graph the node must be located at the point where the curve of $$\psi$$ crosses the horizontal (zero) line, i.e. where it changes from positive to negative (or vice-versa). Among the labelled points A, B, C and D, only point B is situated exactly at such a crossing.
Therefore the point that most accurately represents the nodal surface in the wave-function plot is marked B.
Option A which is: B
Was this solution helpful?
Create a FREE account and get:
_1.webp)

Educational materials for JEE preparation

Ask our AI anything

AI can make mistakes. Please verify important information.
AI can make mistakes. Please verify important information.
