Sign in
Please select an account to continue using cracku.in
↓ →
Join Our JEE Preparation Group
Prep with like-minded aspirants; Get access to free daily tests and study material.
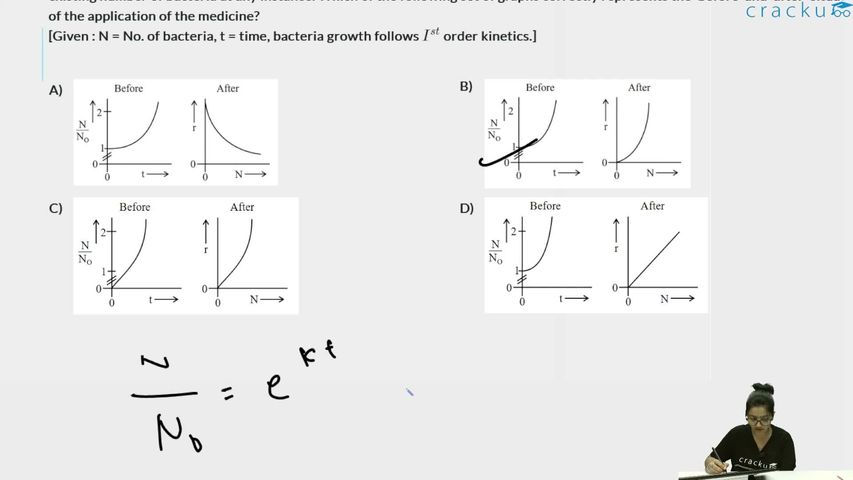
A person's wound was exposed to some bacteria and then bacteria growth started to happen at the same place. The wound was later treated with some antibacterial medicine and the rate of bacterial decay (r) was found to be proportional with the square of the existing number of bacteria at any instance. Which of the following set of graphs correctly represents the 'before' and 'after' situation of the application of the medicine?
[Given : N = No. of bacteria, t = time, bacteria growth follows $$I^{st}$$ order kinetics.]
According to the problem, the bacterial growth follows first-order kinetics.
The differential rate law for first-order growth is:
$$\frac{dN}{dt} = kN$$
Integrating this expression from $$t = 0$$ (where the initial number of bacteria is $$N_0$$) to time $$t$$:
$$\int_{N_0}^{N} \frac{1}{N} \, dN = k \int_{0}^{t} dt$$
$$\ln\left(\frac{N}{N_0}\right) = kt \implies \frac{N}{N_0} = e^{kt}$$
After Applying the Medicine (Bacterial Decay)
The problem states that the rate of bacterial decay ($$r$$) is directly proportional to the square of the existing number of bacteria ($$N$$).
The rate equation is given by:
$$r = -\frac{dN}{dt} = k'N^2$$
Correct option is B
Click on the Email ☝️ to Watch the Video Solution


Educational materials for JEE preparation

Ask our AI anything

AI can make mistakes. Please verify important information.
AI can make mistakes. Please verify important information.