
Solution
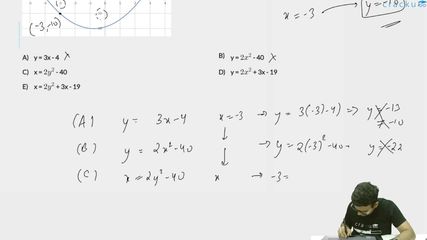
When x = -3, y = -10
This is satisfied only in option D.
Hence, option D is the correct answer.
Get AI Help
Video Solution
Click on the Email ☝️ to Watch the Video Solution
Create a FREE account and get:
- All Quant Formulas and shortcuts PDF
- 15 XAT previous papers with solutions PDF
- XAT Trial Classes for FREE

XAT Quant Questions | XAT Quantitative Ability
XAT Venn Diagrams QuestionsXAT Linear Equations QuestionsXAT Progressions and Series QuestionsXAT Profit and Loss QuestionsXAT Probability, Combinatorics Questions
XAT DILR Questions | LRDI Questions For XAT
XAT Data Interpretation QuestionsXAT Games and Tournamnents QuestionsXAT Truth Lie Concept QuestionsXAT Arrangement QuestionsXAT Data Interpretation Basics Questions
XAT Verbal Ability Questions | VARC Questions For XAT
Free XAT Quant Questions
XAT Probability, CombinatoricsXAT Logarithms, Surds and IndicesXAT GeometryXAT Linear EquationsXAT Quadratic EquationsXAT Averages, Ratio and ProportionXAT InequalitiesXAT Progressions and SeriesXAT Functions, Graphs and StatisticsXAT Venn DiagramsXAT Profit and LossXAT Number SystemsXAT Data SufficiencyXAT Time, Speed and Distance
Book Free CAT Mentorship
Get personalized CAT strategy from a 99%iler
500+ students mentored
OTP Verification
Enter the 6-digit code sent to your phone
Booking Summary
Session:Free CAT Mentorship
Phone:
Date:
Time:
Enter OTP
Didn't receive the OTP?


