Sign in
Please select an account to continue using cracku.in
↓ →
The following figure represents the acceleration verses time graph of a particle which starts its journey from the rest position at time $$t = 0$$. The velocity of the particle at $$t = 5\ \text{s}$$ is
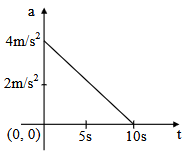
The change in velocity equals the area under the acceleration-time graph. The acceleration falls linearly from $$4\ \text{m/s}^2$$ at $$t = 0$$ to zero at $$t = 10$$ s, so at $$t = 5$$ s it is $$2\ \text{m/s}^2$$. The area from 0 to 5 s is a trapezium, $$\frac{(4 + 2)}{2} \times 5 = 15$$, and since the particle starts from rest its velocity is $$15\ \text{m/s}$$.
Was this solution helpful?


Predict your JEE Main percentile, rank & performance in seconds

Educational materials for JEE preparation

Ask our AI anything

AI can make mistakes. Please verify important information.
AI can make mistakes. Please verify important information.
 91- 6303239042