Sign in
Please select an account to continue using cracku.in
↓ →
Join Our JEE Preparation Group
Prep with like-minded aspirants; Get access to free daily tests and study material.
Gibbs energy vs T plot for the formation of oxides is given below. For the given diagram, the correct statement is-
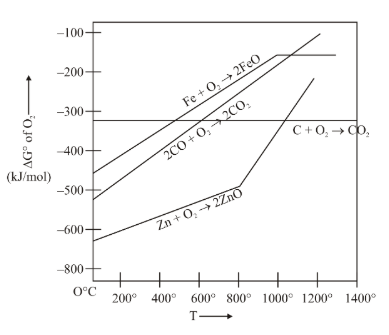
Reason: At 600°C, the carbon monoxide oxidation curve $$2\text{CO} + \text{O}_2 \rightarrow 2\text{CO}_2$$ lies lower than the iron oxide line $$2\text{Fe} + \text{O}_2 \rightarrow 2\text{FeO}$$. This indicates that CO is thermodynamically capable of reducing FeO at this temperature, making the statement false.
Reason: The zinc oxide curve $$\text{Zn} + \text{O}_2 \rightarrow 2\text{ZnO}$$ sits exceptionally low on the diagram (highly negative $$\Delta G^\circ$$ near −650 kJ/mol). Since the CO line is well above it at 600°C, CO cannot reduce ZnO.
Reason: The reduction of ZnO by solid carbon $$2\text{C} + \text{O}_2 \rightarrow 2\text{CO}$$ only becomes favorable above the intersection point, which happens at temperatures well exceeding 900°C. At 600°C, the carbon line is far above the zinc line.
Reason: Based on the standard configuration of this problem in pyrometallurgy, at 600°C, the combined free energy change $$\Delta G^\circ$$ for the coupled reduction reaction yields a negative value, confirming that elemental carbon functions as an effective reducing agent for iron oxide.
Create a FREE account and get:


Educational materials for JEE preparation

Ask our AI anything

AI can make mistakes. Please verify important information.
AI can make mistakes. Please verify important information.
