Sign in
Please select an account to continue using cracku.in
↓ →
Join Our JEE Preparation Group
Prep with like-minded aspirants; Get access to free daily tests and study material.
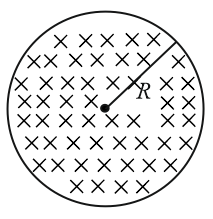
The figure shows a circular area of radius R where a uniform magnetic field $$\vec{B}$$ is going into the plane of the paper and increasing in magnitude at a constant rate. In that case, which of the following graphs, drawn schematically, correctly shows the variation of the induced electric field E(r)?
$$\oint \vec{E} \cdot d\vec{l} = -\frac{d\Phi_B}{dt}$$
Case 1: Inside the Magnetic Field Region ($$r \le R$$)
$$\Phi_B = B \cdot (\pi r^2)$$
$$E(2\pi r) = \frac{d}{dt} \left( B \cdot \pi r^2 \right) = \pi r^2 \frac{dB}{dt}$$
$$E(2\pi r) = \pi r^2 \cdot k$$
$$E = \frac{k}{2} \cdot r \implies E \propto r$$
Thus, inside the region, the induced electric field increases linearly with distance $$r$$, starting from zero at the center.
Case 2: Outside the Magnetic Field Region ($$r > R$$)
$$\Phi_B = B \cdot (\pi R^2)$$
$$E(2\pi r) = \frac{d}{dt} \left( B \cdot \pi R^2 \right) = \pi R^2 \frac{dB}{dt}$$
$$E(2\pi r) = \pi R^2 \cdot k$$
$$E = \frac{k R^2}{2} \cdot \frac{1}{r} \implies E \propto \frac{1}{r}$$
Thus, outside the region, the induced electric field decreases hyperbolically as $$\frac{1}{r}$$.
Hence, the graph in option (A) correctly represents this.
Create a FREE account and get:


Educational materials for JEE preparation

Ask our AI anything

AI can make mistakes. Please verify important information.
AI can make mistakes. Please verify important information.
