Instructions
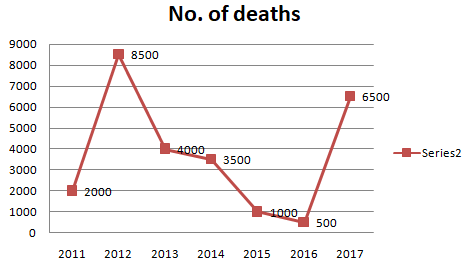
The line graph shows the number of deaths due to rail accidents in a certain state. Study the diagram and answer the following questions.
Year
Solution
Number of deaths in 2017 = 6500
Number of deaths in 2013 = 4000
=> Required % = $$\frac{(6500-4000)}{4000}\times100$$
= $$\frac{2500}{40}=62.5\%$$
=> Ans - (C)
Get AI Help
Video Solution

Click on the Email ☝️ to Watch the Video Solution
Create a FREE account and get:
- Free SSC Study Material - 18000 Questions
- 230+ SSC previous papers with solutions PDF
- 100+ SSC Online Tests for Free


