
Join Our JEE Preparation Group
Prep with like-minded aspirants; Get access to free daily tests and study material.
Sign in
Please select an account to continue using cracku.in
↓ →
Join Our JEE Preparation Group
Prep with like-minded aspirants; Get access to free daily tests and study material.
In the given figure, the energy levels of hydrogen atom have been shown along with some transitions marked A, B, C, D and E. The transitions A, B and C respectively represent
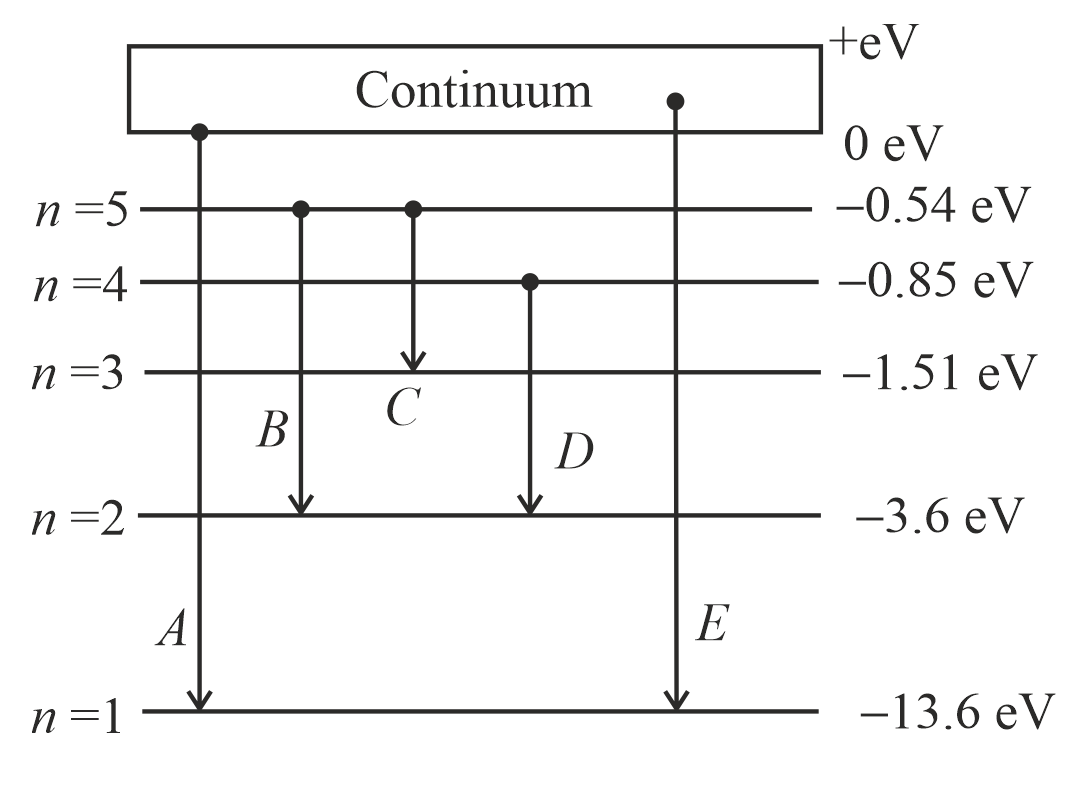
$$\text{Transition A: From the continuum } (n_i = \infty) \text{ to } n_f = 1.$$
$$\text{Transitions ending at } n_f = 1 \text{ belong to the Lyman series. A transition from } \infty$$ represents the shortest wavelength / maximum energy, known as the series limit
$$\therefore \text{Transition A represents the series limit of Lyman series.}$$
$$\text{Transition B: From } n_i = 5 \text{ to } n_f = 2.$$
$$\text{Transitions ending at } n_f = 2 \text{ belong to the Balmer series.}$$
$$\text{The members are ordered by descending energy steps: } n_i=3\,(1^{\text{st}}\text{ member}), \ n_i=4\,(2^{\text{nd}}\text{ member}), \ n_i=5\,(3^{\text{rd}}\text{ member}).$$
$$\therefore \text{Transition B represents the third member of Balmer series.}$$
$$\text{Transition C: From } n_i = 5 \text{ to } n_f = 3.$$
$$\text{Transitions ending at } n_f = 3 \text{ belong to the Paschen series.}$$
$$\text{The members are ordered by descending energy steps: } n_i=4\,(1^{\text{st}}\text{ member}), \ n_i=5\,(2^{\text{nd}}\text{ member}).$$
$$\therefore \text{Transition C represents the second member of Paschen series.}$$
Was this solution helpful?
Click on the Email ☝️ to Watch the Video Solution
_1.webp)

Educational materials for JEE preparation

Ask our AI anything

AI can make mistakes. Please verify important information.
AI can make mistakes. Please verify important information.