Instructions

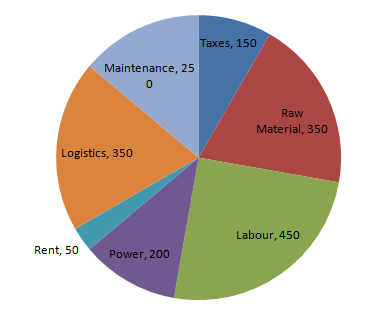
The pie chart shows the breakup of expenditure of a manufacturing company for the year 2017. Study the diagram and answer the following questions.

Solution
Total expenditure (in Rs lakhs)
= 150 + 350 + 450 + 200 + 50 + 350 + 250
= 1800
=> Ans - (B)
Create a FREE account and get:
- Free SSC Study Material - 18000 Questions
- 230+ SSC previous papers with solutions PDF
- 100+ SSC Online Tests for Free

