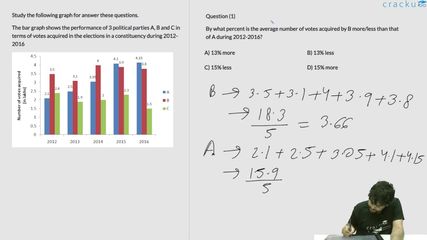
Study the following graph for answer these questions.
The bar graph shows the performance of 3 political parties A, B and C in terms of votes acquired in the elections in a constituency during 2012- 2016

In 2015, by what percent should the votes of C increase to exceed the votes of B in the same year by 12% ?
Solution
B's votes in 2015 were 3.9
We want C's votes to be 12% more, which would be (1.12)(3.0 = 4.368 lakh votes.
C originally got 2.3 lakh votes in 2015
C would require 4.368-2.3 = 2.068 lakh votes
This is close to the real value itself, so we can guess that the answer would be close to 100 percent.
Upon calculation, we would get: $$\frac{2.068}{2.3}\times\ 100=89.91\%$$
Therefore, Option C is the correct answer.
Get AI Help
Video Solution
Click on the Email ☝️ to Watch the Video Solution


