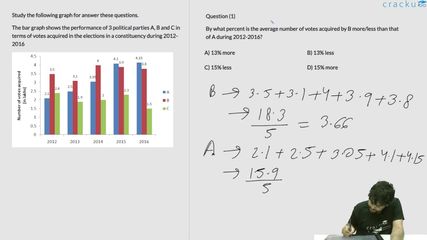
Study the following graph for answer these questions.
The bar graph shows the performance of 3 political parties A, B and C in terms of votes acquired in the elections in a constituency during 2012- 2016

What per cent votes were acquired by C with respect to the total votes acquired by all the three parties in 2013?
Solution
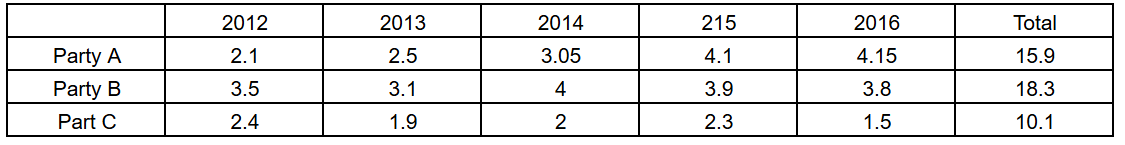
In 2013, all three parties acquired: 2.5+3.1+1.9 = 7.5 lakh votes
Of which $$\frac{1.9}{7.5}\times\ 100=25.33\%$$ of the votes were for C.
Therefore, Option A is the correct answer.
Get AI Help
Video Solution
Click on the Email ☝️ to Watch the Video Solution

SRCC Quant Questions | SRCC Quantitative Ability
SRCC DILR Questions | LRDI Questions For SRCC
SRCC Verbal Ability Questions | VARC Questions For SRCC
Free SRCC DILR Questions
Book Free CAT Mentorship
Get personalized CAT strategy from a 99%iler
500+ students mentored
OTP Verification
Enter the 6-digit code sent to your phone
Booking Summary
Enter OTP
Didn't receive the OTP?


