Answer the questions based on the following information.
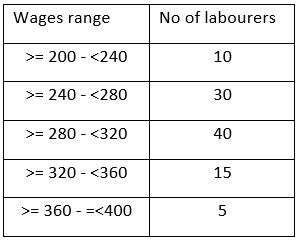
The following bar diagram represents the number of daily wages (in rupees) of 100 labourers in different wage classes on a construction site. Here the class interval a-b includes all wages (in rupees) greater than or equal to a and less than b except for the interval 360-400, where both the end points are included.
No.of labourers

Wages in Rupees
Solution
Let's tabulate the information in the graph ,we get

From the table, it is evident that there are 20 members who got at least 320
Hence C is the correct answer.
Create a FREE account and get:
- All Quant Formulas and shortcuts PDF
- 40+ previous papers with solutions PDF
- Top 500 MBA exam Solved Questions for Free

