The table below shows the data on Government expenditure on the insurance scheme, total expenditure and State's own expenditure on health and family welfare. Read the table carefully and answer the following three questions.
Table: Government Expenditure Across Various Budget Heads
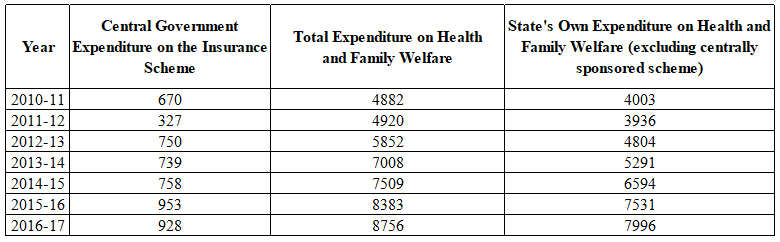
In which year, the Central Government expenditure on the insurance scheme as a percentage of the total expenditure on health and family welfare was highest?
Solution
2010-2011 - $$\frac{67000}{4882}=13.72\%$$
2011-2012 - $$\frac{32700}{4920}=6.64\%$$
2012-2013 - $$\frac{75000}{5852}=12.82\%$$
2013-2014 - $$\frac{73900}{7008}=10.54\%$$
2014-2015 - $$\frac{75800}{7509}=10\%$$
2015-2016 - $$\frac{95300}{8383}=11.37\%$$
2016-2017 - $$\frac{92800}{8756}=10.6\%$$
Answer is option B.
Get AI Help
Create a FREE account and get:
- Download Maths Shortcuts PDF
- Get 300+ previous papers with solutions PDF
- 500+ Online Tests for Free

Book Free CAT Mentorship
Get personalized CAT strategy from a 99%iler
500+ students mentored
OTP Verification
Enter the 6-digit code sent to your phone
Booking Summary
Enter OTP
Didn't receive the OTP?


