Please answer the following three questions based on the data given in the following table
and the notes below.
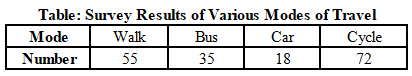
Notes:
A. 1 in 8 of the people who cycled to work were found to be over 65 years of age.
B. 1 in 3 of the cyclists stated that they travelled to work by bus on rainy days.
If this data is represented in a pie chart, then how many degrees of arc in the pie chart represent each response in the survey results?
Solution
There are total 360 degrees in pie chart and there are total of 180 responses. Therefore, each response is represented by two degrees of arc in the pie chart.
Answer is option D.
Get AI Help
Create a FREE account and get:
- Download Maths Shortcuts PDF
- Get 300+ previous papers with solutions PDF
- 500+ Online Tests for Free

Book Free CAT Mentorship
Get personalized CAT strategy from a 99%iler
500+ students mentored
OTP Verification
Enter the 6-digit code sent to your phone
Booking Summary
Enter OTP
Didn't receive the OTP?


