Sign in
Please select an account to continue using cracku.in
↓ →
Join Our JEE Preparation Group
Prep with like-minded aspirants; Get access to free daily tests and study material.
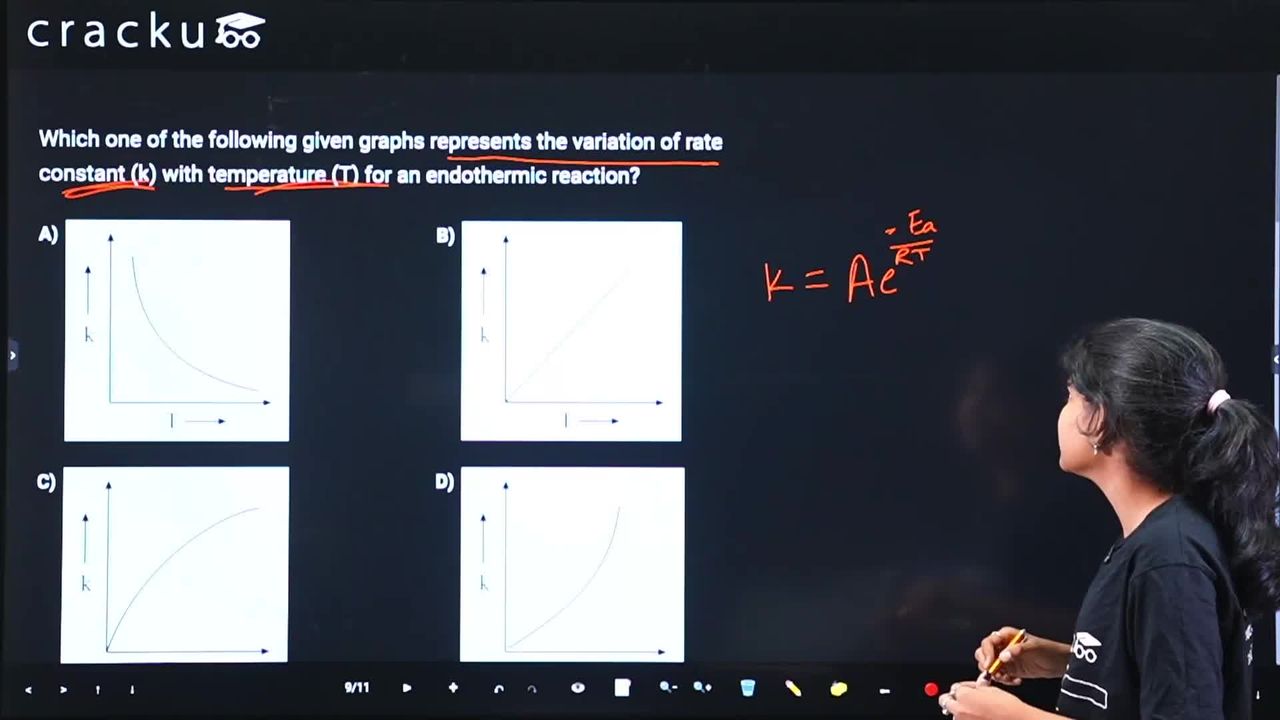
Which one of the following given graphs represents the variation of rate constant (k) with temperature (T) for an endothermic reaction?
The relationship is defined as
$$k = A e^{-E_a / RT}$$, where $$A$$ represents the pre-exponential factor (frequency of collisions), $$E_a$$ is the activation energy, $$R$$
is the universal gas constant ($$8.314 \text{ J K}^{-1} \text{mol}^{-1}$$), and $$T$$ is the temperature in Kelvin ($$K$$). So the graph will be increasing exponentially. Thus, the right option is D.
Click on the Email ☝️ to Watch the Video Solution
Create a FREE account and get:


Educational materials for JEE preparation

Ask our AI anything

AI can make mistakes. Please verify important information.
AI can make mistakes. Please verify important information.
