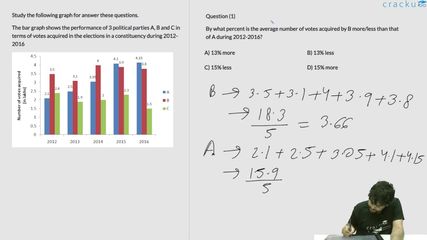
Study the following graph for answer these questions.
The bar graph shows the performance of 3 political parties A, B and C in terms of votes acquired in the elections in a constituency during 2012- 2016

By what percent is the average number of votes acquired by B more/less than that of A during 2012-2016?
Solution
In calculating the average number of votes by the same number (5), we can solve the question using the raw value of total votes as well.
We need to add up the total number of votes of A and B for years 2012-2016.
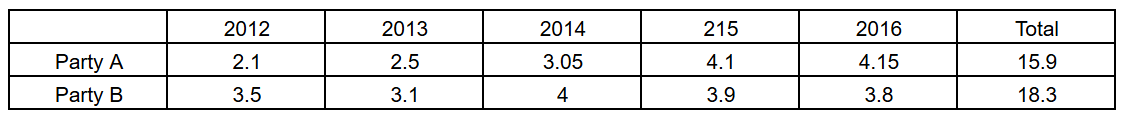
Party B acquired 2.4 (lakh) votes more than party A.
This, as a percentage, would be $$\frac{2.4}{15.9}\times\ 100\approx\ 15\%$$
Therefore, Option D is the correct answer.
Get AI Help
Video Solution
Click on the Email ☝️ to Watch the Video Solution

SRCC Quant Questions | SRCC Quantitative Ability
SRCC DILR Questions | LRDI Questions For SRCC
SRCC Verbal Ability Questions | VARC Questions For SRCC
Free SRCC DILR Questions
Book Free CAT Mentorship
Get personalized CAT strategy from a 99%iler
500+ students mentored
OTP Verification
Enter the 6-digit code sent to your phone
Booking Summary
Enter OTP
Didn't receive the OTP?


