Question 130
The given pie chart shows the distribution of land under various food crops. The expenditure invested on these food crops is ₹25,000 per annum. Study the pie chart carefully and answer the question that follows.
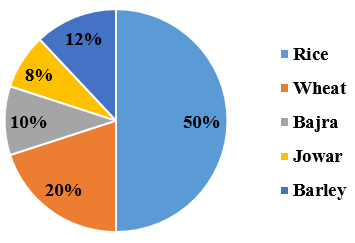
The expenditure invested in Rice and Barley is what percentage (correct to 2 decimal places) of the expenditure invested in Wheat and Bajra?
Create a FREE account and get:
- Free SSC Study Material - 18000 Questions
- 230+ SSC previous papers with solutions PDF
- 100+ SSC Online Tests for Free


