SSC Venn Diagram Questions
SSC 2021 Venn Diagram questions
Question 1
Select the Venn diagram that best illustrates the relationship among the following classes.
Whisk, Utensil, Sickle
correct answer:-2
Question 2
Select the set of classes, the relationship among which is best illustrated by the following Venn diagram.

correct answer:-3
Question 3
Select the Venn diagram that best illustrates the relationship among the following classes.
Reptiles, Frogs, Animals
correct answer:-2
Question 4
In the following figure, the triangle represents 'carpenters', the circle represents 'black-smiths'. and the rectangle represents 'fishermen'. How many people are NOT carpenters?

correct answer:-4
Question 5
Select the Venn diagram that best illustrates the relationship among the following classes.
Women, Employed, Mothers
correct answer:-3
Question 6
Select the Venn diagram that best illustrates the relationship among the following classes.
Females, Relatives, Uncles
correct answer:-1
Question 7
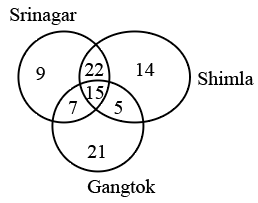
The following Venn diagram shows the number of families who have visited three different places (Srinagar, Shimla, Gangtok).

What is the number of families who have visited at least two of the places out of Srinagar, Shimla and Gangtok?
correct answer:-2
Question 8
Select the Venn diagram that best illustrates the relationship between the following classes.
Coriander seeds, Spices, Cinnamon
correct answer:-4
Question 9
In a restaurant, 40% customers had a non-vegetarian lunch, 52% had a vegetarian lunch, and 20% had both types of lunches. If 125 customers were present, how many did NOT eat either type of lunch?
correct answer:-3
SSC 2020 Venn Diagram questions
Question 1
Which of the following Venn diagram best represents the relationship between the following classes? Income tax payers, Employees, Males
correct answer:-2
Question 2
Select the Venn diagram that best represents the relationship between the following classes.
Star, Sun, Mercury
correct answer:-4
Question 3
Which one of the following diagramsbest depicts the relationship among College Graduates, Professional Athletes and Great Scientists?
correct answer:-3
Question 4
Select the Venn diagram that represents the correct relationship between the following classes:
Table, Stationary, Carpet
correct answer:-1
Question 5
Which of the given diagrams correctly represents the relationship among
Mammals, Reptiles and Birds ?
correct answer:-3
Question 6
In the given figure, the circle stands for intelligent, square for hardworking, triangle for Post graduate and the rectangle for loyal employees. Study the figure and answer the following questions. Employees who are intelligent, hardworking and loyal but not Post graduate are represented by

correct answer:-3
SSC 2019 Venn Diagram questions
Question 1
Select the Venn diagram that best illustrates the relationship between the three given classes.
Keyboard, Monitor, Mouse
correct answer:-2
Question 2
In the given Venn diagram, the circle represents ‘businessmen’, the triangle represents ‘landlords’ and the rectangle represents ‘income tax payers’. The numbers given in the diagram represent the number of persons in that particular category.

How many businessmen are tax payers but NOT landlords?
correct answer:-1
Question 3
In the following diagram, the triangle represents ‘cricket players’, the circle represents ‘students’, the rectangle represents ‘boys’ and the square represents ‘dancers’. The numbers in different segments show the number of persons.

How many students are dancers and cricket players but not boys?
correct answer:-1
Question 4
Select the Venn diagram that best represents the given set of classes.
Austria, Denmark, Countries
correct answer:-4
Question 5
Select the Venn diagram that best illustrates the relationship between the three given classes.
Carrot, Vegetables, Meat
correct answer:-4

