Question 128
Study the given graph and answer the question that follows.
The following graph shows the distribution of the cost percentage of different items.
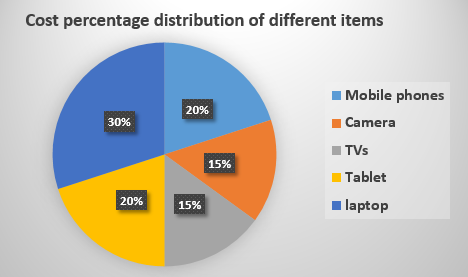
If a person purchased all the items for =₹3,00,000, then the cost of a TV is less than that of a laptop by:
Create a FREE account and get:
- Free SSC Study Material - 18000 Questions
- 230+ SSC previous papers with solutions PDF
- 100+ SSC Online Tests for Free


