Instructions
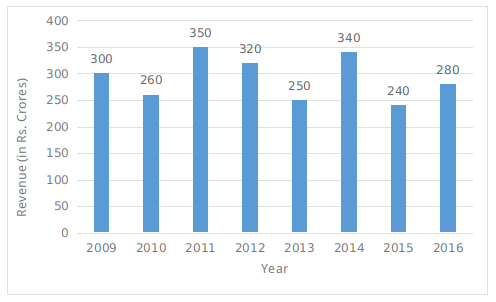
The bar graph given below represents the revenue of a firm for 8 years. All the revenue figures have been shown in terms of Rs crores.
Question 125
In which year the firm has shown maximum percentage increase in its revenue with respect to the previous year?
Solution
Percentage increase from the year 2010 to 2011 = (90/260) x 100 = 34.6% (approx)
Percentage increase from the year 2013 to 2014 = (90/250) x 100 = 36 %
Percentage increase from the year 2015 to 2016 = (40/240) x 100 = 16.67% (approx)
Percentage increase is maximum in 2014 from its previous year.
Hence, option B is the correct answer.
Get AI Help
Create a FREE account and get:
- Free SSC Study Material - 18000 Questions
- 230+ SSC previous papers with solutions PDF
- 100+ SSC Online Tests for Free


