Sign in
Please select an account to continue using cracku.in
↓ →
Join Our JEE Preparation Group
Prep with like-minded aspirants; Get access to free daily tests and study material.
A certain amount of gas is taken through a cyclic process (A B C D A) that has two isobars, one isochore and one isothermal. The cycle can be represented on a P - V indicator diagram as :
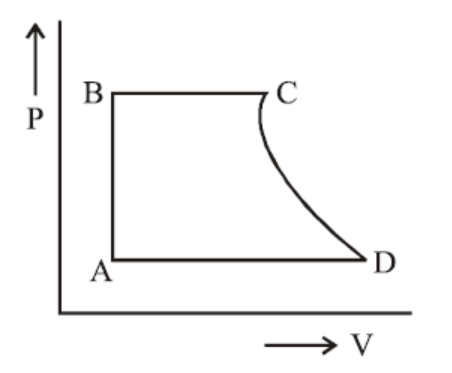
Two Isobars: Processes BC and AD are horizontal lines.
One Isochore: Process AB is a vertical line.
One Isothermal: Process CD is a hyperbolic curve.
Create a FREE account and get:


Educational materials for JEE preparation

Ask our AI anything

AI can make mistakes. Please verify important information.
AI can make mistakes. Please verify important information.
