Sign in
Please select an account to continue using cracku.in
↓ →
Join Our JEE Preparation Group
Prep with like-minded aspirants; Get access to free daily tests and study material.
For the $$P - V$$ diagram given for an ideal gas
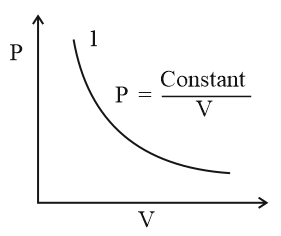
Out of the following which one correctly represents the $$T - P$$ diagram?
From the provided graph, we are given the equation governing the thermodynamic state transition from point 1 to point 2:
$$P = \frac{\text{Constant}}{V} \implies P \cdot V = \text{Constant}$$
This relationship ($$P \cdot V = C$$) defines an isothermal process, which means the temperature ($$T$$) of the ideal gas remains perfectly constant throughout the entire expansion/compression path.
The ideal gas equation state relation is given by:
$$P \cdot V = n \cdot R \cdot T$$
Looking closely at the graph from point 1 to point 2:
To translate this path onto a Temperature vs. Pressure ($$T - P$$) coordinate plane:
Therefore, on a standard $$T - P$$ plot where $$T$$ is on the vertical axis and $$P$$ is on the horizontal axis, the process is represented by a flat horizontal line starting at a high pressure point 1 and moving leftward to a lower pressure point 2.
Concept Check: An isothermal line always maps out horizontally on any graph where temperature acts as the dependent vertical metric, where its tracking arrow direction is purely dictated by whether the system is undergoing compression or expansion.
Correct Option Key: Option A (Horizontal line where T remains constant as pressure drops)

Click on the Email ☝️ to Watch the Video Solution
Create a FREE account and get:


Educational materials for JEE preparation

Ask our AI anything

AI can make mistakes. Please verify important information.
AI can make mistakes. Please verify important information.
