Sign in
Please select an account to continue using cracku.in
↓ →
Join Our JEE Preparation Group
Prep with like-minded aspirants; Get access to free daily tests and study material.
An ideal gas goes through a reversible cycle $$a \rightarrow b \rightarrow c \rightarrow d$$ has the V - T diagram shown below. Process $$d \rightarrow a$$ and $$b \rightarrow c$$ are adiabatic.
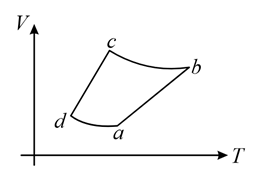
The corresponding P - V diagram for the process is (all figures are schematic and not drawn to scale):
(a → b): V↑,T↑ → Isobaric expansion → horizontal line rightward in P − V
(b → c): V↑,T↓ → Adiabatic expansion → curve downwards (right)
(c → d): V↓,T↓ → Isobaric compression → horizontal line leftward
(d → a): V↓,T↑ → Adiabatic compression → curve upwards (left)
Option (A) correctly represents this behaviour.
Create a FREE account and get:


Educational materials for JEE preparation

Ask our AI anything

AI can make mistakes. Please verify important information.
AI can make mistakes. Please verify important information.
