Sign in
Please select an account to continue using cracku.in
↓ →
Join Our JEE Preparation Group
Prep with like-minded aspirants; Get access to free daily tests and study material.
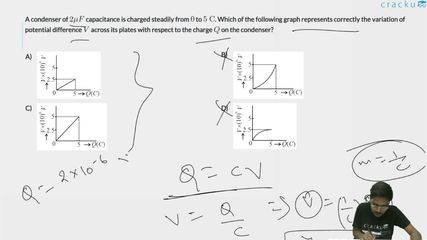
A condenser of $$2 \mu F$$ capacitance is charged steadily from $$0$$ to $$5 \text{ C}$$. Which of the following graph represents correctly the variation of potential difference $$V$$ across its plates with respect to the charge $$Q$$ on the condenser?
We need to determine the correct graph representing the variation of potential difference ($$V$$) across a condenser's plates with respect to the charge ($$Q$$) on it.
The fundamental relationship between the charge stored in a capacitor, its capacitance ($$C$$), and the voltage across its plates is given by:
$$Q = C \times V$$
Rearranging the equation to solve for $$V$$ (since $$V$$ is plotted on the vertical $$y$$-axis and $$Q$$ is plotted on the horizontal $$x$$-axis):
$$V = \left(\frac{1}{C}\right) \cdot Q$$
This matches the equation of a straight line passing through the origin ($$y = mx$$), where:
From the problem
Substitute these values into our equation to find the corresponding maximum voltage:
$$V = \frac{5}{2 \times 10^{-6}} = 2.5 \times 10^6\text{ V}$$
The vertical axis on the graph is scaled by a factor of $$10^6\text{ V}$$. Therefore, the value shown on the $$y$$-axis at $$Q = 5\text{ C}$$ must be $$2.5$$.
The correct graph is a straight line starting from zero and reaching a peak coordinate of $$(5, 2.5)$$. This matches Option A perfectly.
Click on the Email ☝️ to Watch the Video Solution
Create a FREE account and get:


Educational materials for JEE preparation

Ask our AI anything

AI can make mistakes. Please verify important information.
AI can make mistakes. Please verify important information.
