Join Our JEE Preparation Group
Prep with like-minded aspirants; Get access to free daily tests and study material.
Sign in
Please select an account to continue using cracku.in
↓ →
Join Our JEE Preparation Group
Prep with like-minded aspirants; Get access to free daily tests and study material.
The variation of displacement with time of a particle executing free simple harmonic motion is shown in the figure.
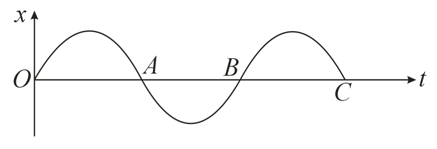
The potential energy $$U(x)$$ versus time $$(t)$$ plot of the particle is correctly shown in figure:
We need to identify the correct potential energy ($$U$$) versus time ($$t$$) graph for a particle executing free simple harmonic motion (SHM), given its displacement-time curve.
Therefore, its kinematic equation is: $$x(t) = A \sin(\omega t)$$.
$$U(t) = \frac{1}{2} k x^2 = \frac{1}{2} k A^2 \sin^2(\omega t)$$
Looking at the option:
Final Answer: Option D (The plot containing entirely positive, upward-only loops starting from the origin)
Create a FREE account and get:
_1.webp)

Educational materials for JEE preparation

Ask our AI anything

AI can make mistakes. Please verify important information.
AI can make mistakes. Please verify important information.