Sign in
Please select an account to continue using cracku.in
↓ →
Join Our JEE Preparation Group
Prep with like-minded aspirants; Get access to free daily tests and study material.
Figure shows the variation in temperature ($$\Delta T$$) with the amount of heat supplied (Q) in an isobaric process corresponding to a monoatomic (M), diatomic (D) and a polyatomic (P) gas. The initial state of all the gases are the same and the scales for the two axes coincide. Ignoring vibrational degrees of freedom, the lines a, b and c respectively correspond to :
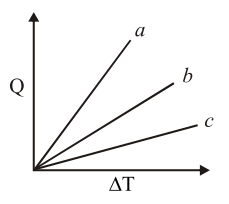
The problem involves identifying which lines a, b, and c correspond to monoatomic (M), diatomic (D), and polyatomic (P) gases on a graph of temperature change ($$\Delta T$$) versus heat supplied (Q) for an isobaric process. The initial state is the same for all gases, and vibrational degrees of freedom are ignored.
In an isobaric process, the heat supplied Q is related to the change in temperature $$\Delta T$$ by the equation:
$$ Q = n C_P \Delta T $$
where n is the number of moles and $$C_P$$ is the molar specific heat at constant pressure. Rearranging for $$\Delta T$$:
$$ \Delta T = \frac{Q}{n C_P} $$
Since n is the same for all gases (same initial state), $$\Delta T$$ is inversely proportional to $$C_P$$. Therefore, for a given Q, a higher $$C_P$$ results in a smaller $$\Delta T$$. On the graph with $$\Delta T$$ on the y-axis and Q on the x-axis, the slope of each line ($$\Delta T$$ per unit Q) is inversely proportional to $$C_P$$. Thus, a gas with a larger $$C_P$$ will have a flatter slope, and a gas with a smaller $$C_P$$ will have a steeper slope.
Now, we determine $$C_P$$ for each gas type, ignoring vibrational degrees of freedom:
Comparing the $$C_P$$ values:
$$ C_P(\text{M}) = \frac{5}{2}R = 2.5R $$
$$ C_P(\text{D}) = \frac{7}{2}R = 3.5R $$
$$ C_P(\text{P}) = 4R = 4.0R $$
So, $$C_P(\text{M}) < C_P(\text{D}) < C_P(\text{P})$$.
Since $$\Delta T$$ is inversely proportional to $$C_P$$, the slope of the line ($$\Delta T$$ vs Q) is largest for the gas with the smallest $$C_P$$ and smallest for the gas with the largest $$C_P$$:
Therefore, the lines on the graph, ordered from steepest to flattest slope, correspond to M, D, P. The problem asks for lines a, b, and c respectively. Given the correct answer is Option B, which is M, D, P, this means:
Hence, the correct answer is Option B.
Create a FREE account and get:


Educational materials for JEE preparation

Ask our AI anything

AI can make mistakes. Please verify important information.
AI can make mistakes. Please verify important information.
