Sign in
Please select an account to continue using cracku.in
↓ →
Join Our JEE Preparation Group
Prep with like-minded aspirants; Get access to free daily tests and study material.
Consider the given plots of vapour pressure (VP) vs temperature (T/K). Which amongst the following options is correct graphical representation showing $$\Delta T_f,$$ depression in the freezing point of a solvent in a solution?
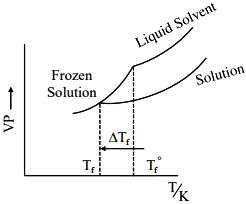
Vapor Pressure Lowering:
The addition of a non-volatile solute lowers the vapor pressure of the liquid solvent. Therefore, at any given temperature, the vapor pressure curve of the solution always lies below the vapor pressure curve of the pure liquid solvent.
Definition of Freezing Point:
The freezing point is the specific temperature at which the liquid phase and the solid phase of a substance coexist in dynamic equilibrium, meaning they have the exact same vapor pressure.
Intersection Points on the Graph:
Because the solution curve lies below the pure liquid solvent curve, its intersection with the steep frozen solvent line occurs at a lower temperature compared to the pure liquid solvent:
$$T_f < T_f^0$$
The depression in freezing point ($$\Delta T_f$$) is the horizontal distance between these two temperatures on the temperature ($$T/K$$) axis:
$$\Delta T_f = T_f^0 - T_f$$
The correct graph must clearly show three distinct lines: the pure liquid solvent (top curve), the solution (bottom curve), and the frozen solvent (steep intersecting line), with $$\Delta T_f$$ representing the drop in freezing temperature along the x-axis.
Click on the Email ☝️ to Watch the Video Solution
Create a FREE account and get:


Educational materials for JEE preparation

Ask our AI anything

AI can make mistakes. Please verify important information.
AI can make mistakes. Please verify important information.
