Sign in
Please select an account to continue using cracku.in
↓ →
Join Our JEE Preparation Group
Prep with like-minded aspirants; Get access to free daily tests and study material.
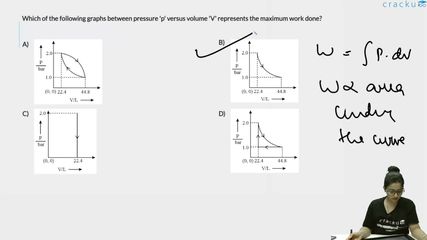
Which of the following graphs between pressure 'p' versus volume 'V' represents the maximum work done?
Concept: Work done in a P-V diagram is the area under the curve (W = ∫P dV). For the same initial and final states, the path that maintains higher pressure during expansion gives maximum work.
Explanation: All graphs represent expansion from (P = 2 bar, V = 22.4 L) to (P = 1 bar, V = 44.8 L). The curve that stays at higher pressure for most of the volume change encloses the largest area. Among the given options, graph B maintains comparatively higher pressure throughout expansion, so it gives maximum area under the curve.
Answer: Option B
Click on the Email ☝️ to Watch the Video Solution
Create a FREE account and get:


Educational materials for JEE preparation

Ask our AI anything

AI can make mistakes. Please verify important information.
AI can make mistakes. Please verify important information.
