The given table shows the number (in thousands)of cars of five different models A, B. C, D and E produced during Years 2012-2017. Study the table and answer the question that follow.
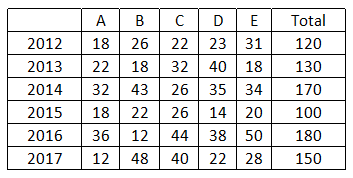
The percentage decrease in the production of which type of car in 2017, with reference to 2016, was the maximum?
Solution
The percentage decrease in the production of A type of car in 2017, with reference to 2016 = $$\frac{36 - 12}{36} \times 100 = \frac{24}{36} \times 100 = 66.66%
B type of car have increments in the production in 2017, with reference to 2016.
The percentage decrease in the production of C type of car in 2017, with reference to 2016 = $$\frac{44 - 40}{44} \times 100 = \frac{4}{44} \times 100 = 9.09%
The percentage decrease in the production of D type of car in 2017, with reference to 2016 = $$\frac{38 - 22}{38} \times 100 = \frac{16}{38} \times 100 = 42.1%
The percentage decrease in the production of E type of car in 2017, with reference to 2016 = $$\frac{50 - 28}{50} \times 100 = \frac{22}{50} \times 100 = 44%
A type of car have maximum decrements in the production in 2017, with reference to 2016.
Get AI Help
Create a FREE account and get:
- Free SSC Study Material - 18000 Questions
- 230+ SSC previous papers with solutions PDF
- 100+ SSC Online Tests for Free


