Sign in
Please select an account to continue using cracku.in
↓ →
Join Our JEE Preparation Group
Prep with like-minded aspirants; Get access to free daily tests and study material.
Consider a solution of $$CO_{2} (g)$$ dissolved in water in a closed container.
Which one of the following plots correctly represents variation of log (partial pressure of $$CO_{2}$$ in vapour phase above water) [y-axis] with log (mole fraction of $$CO_{2}$$ in water) [x-axis] at $$ 25^{o}C $$?
We need to identify the correct plot that represents the variation of $$\log (p_{\text{CO}_2})$$ against $$\log (x_{\text{CO}_2})$$ for a solution of carbon dioxide gas dissolved in water in a closed container at $$25 ^\circ\text{C}$$.
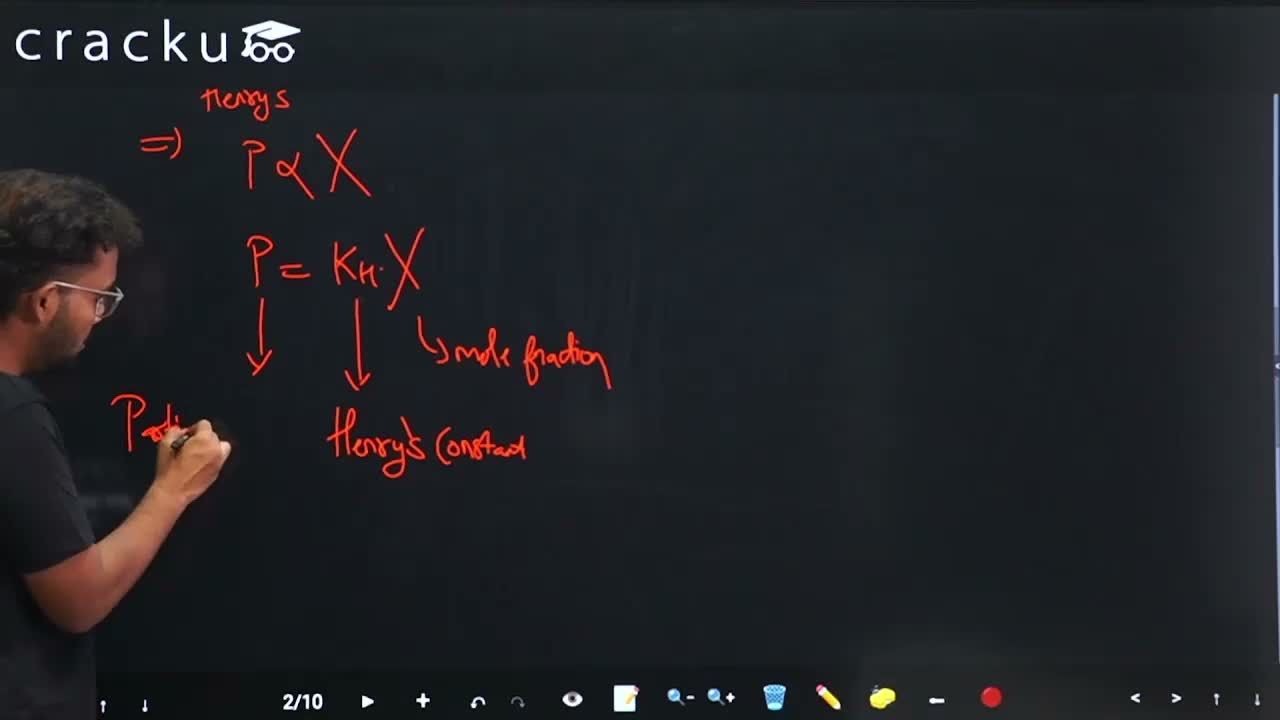
According to Henry's Law:
The partial pressure of a gas in the vapour phase ($$p$$) is directly proportional to the mole fraction of the gas ($$x$$) in the solution.
$$p = K_H \cdot x$$
Where $$K_H$$ is the Henry's law constant for the gas at a given temperature.
Taking the logarithm on both sides of the equation:
$$\log(p) = \log(K_H \cdot x)$$
$$\log(p) = \log(K_H) + \log(x)$$
Rearranging into the standard straight-line equation form ($$y = mx + c$$):
$$\log(p) = 1 \cdot \log(x) + \log(K_H)$$
Comparing this with $$y = mx + c$$, we can see that:
The dependent variable ($$y$$) is $$\log(p_{\text{CO}_2})$$.
The independent variable ($$x$$) is $$\log(x_{\text{CO}_2})$$.
The slope ($$m$$) is equal to $$1$$, which is a positive constant value.
The y-intercept ($$c$$) is equal to $$\log(K_H)$$.
Since the slope is positive ($$+1$$) and there is a definite positive y-intercept, the correct plot is a straight line rising upwards that does not pass through the origin.
This corresponds exactly to the plot shown in option A.
Answer: Option A
Click on the Email ☝️ to Watch the Video Solution
Create a FREE account and get:


Educational materials for JEE preparation

Ask our AI anything

AI can make mistakes. Please verify important information.
AI can make mistakes. Please verify important information.
