Sign in
Please select an account to continue using cracku.in
↓ →
Join Our JEE Preparation Group
Prep with like-minded aspirants; Get access to free daily tests and study material.
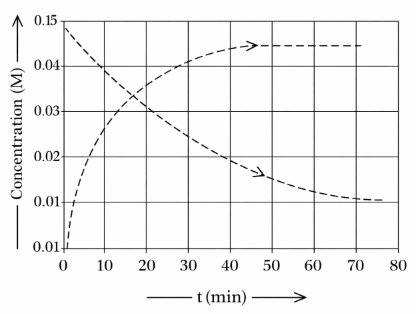
Given above is the concentration vs time plot for a dissociation reaction : $$A \rightarrow nB$$ .
Based on the data of the initial phase of the reaction (initial 10 min), the value of n is________.
Create a FREE account and get:


Educational materials for JEE preparation

Ask our AI anything

AI can make mistakes. Please verify important information.
AI can make mistakes. Please verify important information.
