Sign in
Please select an account to continue using cracku.in
↓ →
Join Our JEE Preparation Group
Prep with like-minded aspirants; Get access to free daily tests and study material.
For the following graphs,
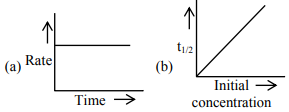
Choose from the options given below, the correct one regarding order of reaction is:
For a zero-order reaction:
$$\mathrm{Rate = k[A]^0 = k}$$
the rate is independent of concentration.
Hence, in graph (a), rate remains constant with time, giving a horizontal line.
For zero-order reactions, half-life is:
$$\mathrm{t_{1/2} = \frac{[A]_0}{2k}}$$
Thus:
$$\mathrm{t_{1/2} \propto [A]_0}$$
Therefore, graph (b) gives a straight line passing through the origin and represents zero-order kinetics.
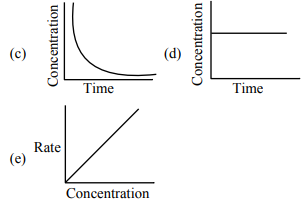
For a first-order reaction:
$$\mathrm{Rate = k[A]}$$
The integrated rate equation is:
$$\mathrm{[A] = [A]_0 e^{-kt}}$$
Thus, concentration decreases exponentially with time.
Hence, graph (c) represents first-order kinetics.
For first-order reactions:
$$\mathrm{Rate \propto [A]}$$
Therefore, graph (e), which is a straight line between rate and concentration passing through the origin, also represents first-order kinetics.
Graph (d) shows constant concentration with time.
This means concentration does not decrease and effectively no reaction occurs.
Therefore:
$$\mathrm{(a)\ and\ (b)\ \rightarrow\ Zero\ Order}$$
$$\mathrm{(c)\ and\ (e)\ \rightarrow\ First\ Order}$$
Create a FREE account and get:


Educational materials for JEE preparation

Ask our AI anything

AI can make mistakes. Please verify important information.
AI can make mistakes. Please verify important information.
