Sign in
Please select an account to continue using cracku.in
↓ →
Join Our JEE Preparation Group
Prep with like-minded aspirants; Get access to free daily tests and study material.
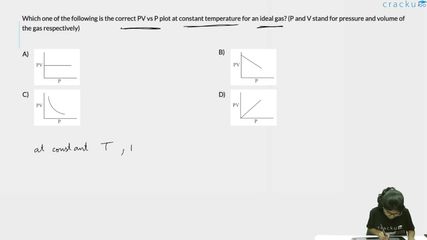
Which one of the following is the correct PV vs P plot at constant temperature for an ideal gas? (P and V stand for pressure and volume of the gas respectively)
At constant T, PV is constant. Thus, the PV graph is a straight line.
Click on the Email ☝️ to Watch the Video Solution
Create a FREE account and get:


Educational materials for JEE preparation

Ask our AI anything

AI can make mistakes. Please verify important information.
AI can make mistakes. Please verify important information.
