Sign in
Please select an account to continue using cracku.in
↓ →
Join Our JEE Preparation Group
Prep with like-minded aspirants; Get access to free daily tests and study material.
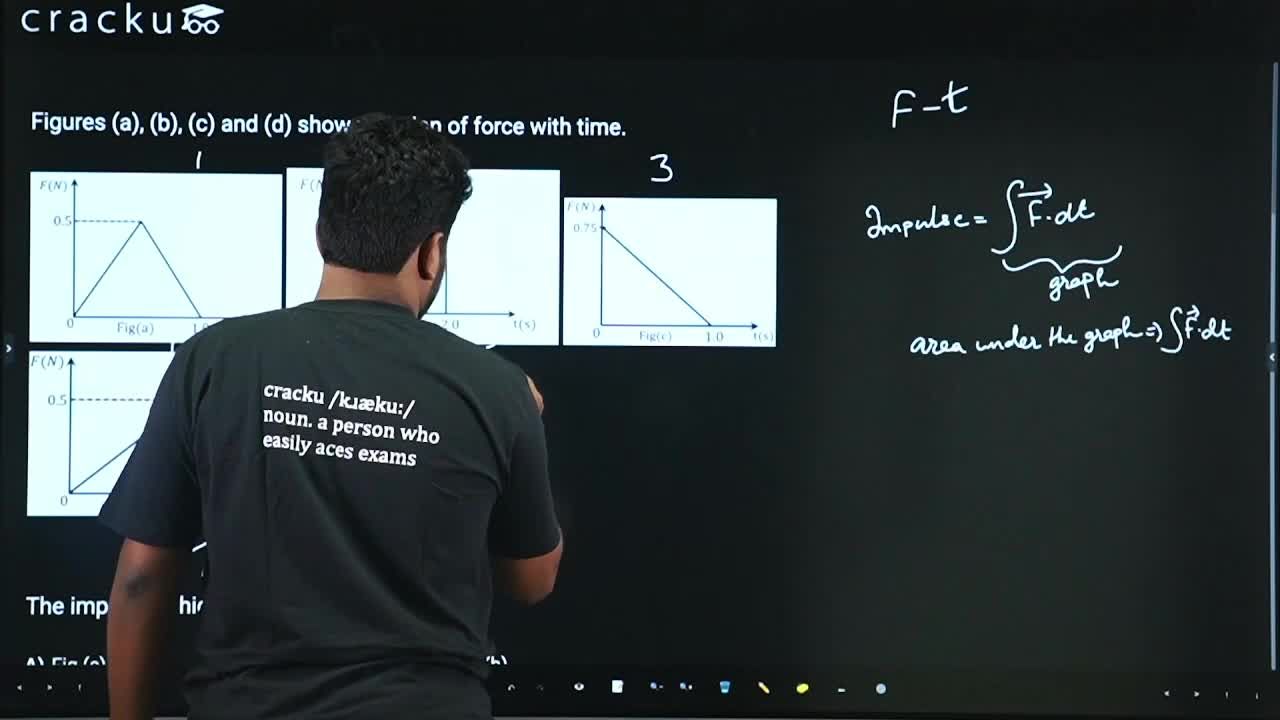
Figures (a), (b), (c) and (d) show variation of force with time.
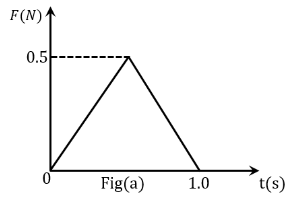
The impulse is highest in figure.
To compare impulses, remember one key idea:
Impulse = area under the F-t graph
Now evaluate each figure based on its shape and dimensions:
For graph a
This is a triangle with $$base\ 1s\ and\ hieght\ 0.5N$$.
Area (impulse) =
$$\frac{1}{2}\times\ 1\times\ 0.5=0.25N$$
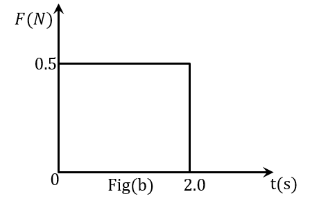
For graph B
This is a rectangle with constant force $$0.5N\ \ for\ a\ time\ of\ 2s$$.
Area (impulse) =
$$0.5\times\ 2\ =1N$$
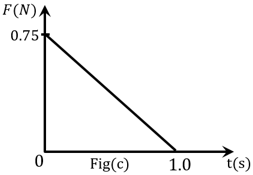
For graph C
Triangle with base 1 s and height 0.75 N
Area =
$$\frac{1}{2}\times\ 1\times\ 0.75=0.375N$$
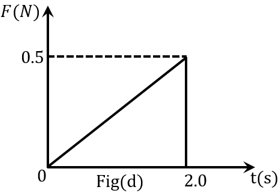
For graph D
Triangle with base 2 s and height 0.5
Area =$$\frac{1}{2}\times\ 2\times\ 0.5=0.5N$$
Therefore from this we can conclude that fig(b) has the highest impulse
Click on the Email ☝️ to Watch the Video Solution
Create a FREE account and get:


Educational materials for JEE preparation

Ask our AI anything

AI can make mistakes. Please verify important information.
AI can make mistakes. Please verify important information.
