Sign in
Please select an account to continue using cracku.in
↓ →
Join Our JEE Preparation Group
Prep with like-minded aspirants; Get access to free daily tests and study material.
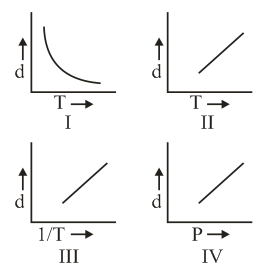
Which one of the following graphs is not correct for ideal gas?
d = Density, P = Pressure, T = Temperature
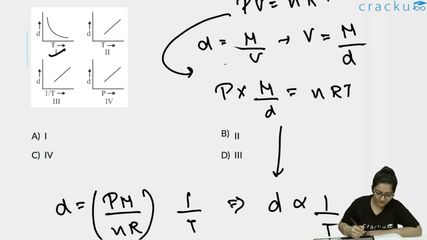
The ideal gas equation can be rewritten to express density by combining the basic gas law with molecular weight properties:
$$PV = nRT = \frac{m}{M}RT$$
Rearranging the equation to solve for density ($$d = \frac{m}{V}$$) gives:
$$P = \frac{m}{V}\frac{RT}{M} \implies P = \frac{dRT}{M}$$
Isolating the density ($$d$$), we get our working formula:
$$d = \left(\frac{M}{R}\right)\frac{P}{T}$$
Graph I: $$d$$ vs $$T$$ (at constant $$P$$)
Graph II: $$d$$ vs $$T$$ (at constant $$P$$)
Graph III: $$d$$ vs $$\frac{1}{T}$$ (at constant $$P$$)
Graph IV: $$d$$ vs $$P$$ (at constant $$T$$)
Because density is inversely related to temperature at a constant pressure, Graph II is geometrically and scientifically flawed.
Answer: Option B — II
Click on the Email ☝️ to Watch the Video Solution
Create a FREE account and get:


Educational materials for JEE preparation

Ask our AI anything

AI can make mistakes. Please verify important information.
AI can make mistakes. Please verify important information.
