Sign in
Please select an account to continue using cracku.in
↓ →
Join Our JEE Preparation Group
Prep with like-minded aspirants; Get access to free daily tests and study material.
In a photoelectric effect experiment, the graph of stopping potential $$V$$ versus reciprocal of wavelength obtained is shown in the figure. As the intensity of incident radiation is increased:
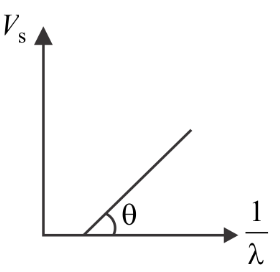
$$\text{Einstein's photoelectric equation: } eV_s = \frac{hc}{\lambda} - \phi \implies V_s = \left(\frac{hc}{e}\right)\frac{1}{\lambda} - \frac{\phi}{e}$$
$$\text{Comparing with the straight line equation } y = mx + c\text{, the slope is } m = \frac{hc}{e} \text{ and the x-intercept is } \frac{1}{\lambda_0} = \frac{\phi}{hc}.$$
$$\text{Since } h, c, e$$, and the work function $$\phi$$ are constants for a given photosensitive material, the graph is entirely independent of intensity.
Increasing the intensity only increases the number of photons and the saturation current, leaving the stopping potential and the graph unaltered
Create a FREE account and get:


Educational materials for JEE preparation

Ask our AI anything

AI can make mistakes. Please verify important information.
AI can make mistakes. Please verify important information.
