Sign in
Please select an account to continue using cracku.in
↓ →
Join Our JEE Preparation Group
Prep with like-minded aspirants; Get access to free daily tests and study material.
A source of sound emits sound waves at frequency $$f_0$$. It is moving towards an observer with fixed speed $$v_s$$ $$(v_s < v)$$, where $$v$$ is the speed of sound in air. If the observer were to move towards the source with speed $$v_0$$, one of the following two graphs (A and B) will give the correct variation of the frequency $$f$$ heard by the observer as $$v_0$$ is changed.
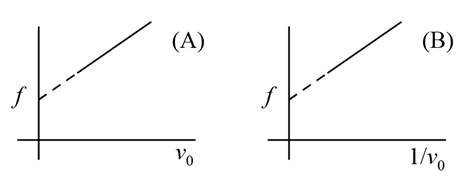
The variation of $$f$$ with $$v_0$$ is given correctly by:
For a source and observer moving toward each other, the observed frequency $$f$$ is given by:
$$f = f_0 \left( \frac{v + v_0}{v - v_s} \right)$$
To find the correct graph, we rewrite this expression in the linear form $$y = mx + c$$, where $$y = f$$ and $$x = v_0$$:
$$f = \left( \frac{f_0}{v - v_s} \right) v_0 + \frac{f_0 v}{v - v_s}$$
Because $$f$$ is a linear function of $$v_0$$, the graph must be a straight line with a positive intercept. This corresponds to Graph A.
$$\text{Slope} = \frac{f_0}{v - v_s}$$
Create a FREE account and get:


Educational materials for JEE preparation

Ask our AI anything

AI can make mistakes. Please verify important information.
AI can make mistakes. Please verify important information.
