Sign in
Please select an account to continue using cracku.in
↓ →
Join Our JEE Preparation Group
Prep with like-minded aspirants; Get access to free daily tests and study material.
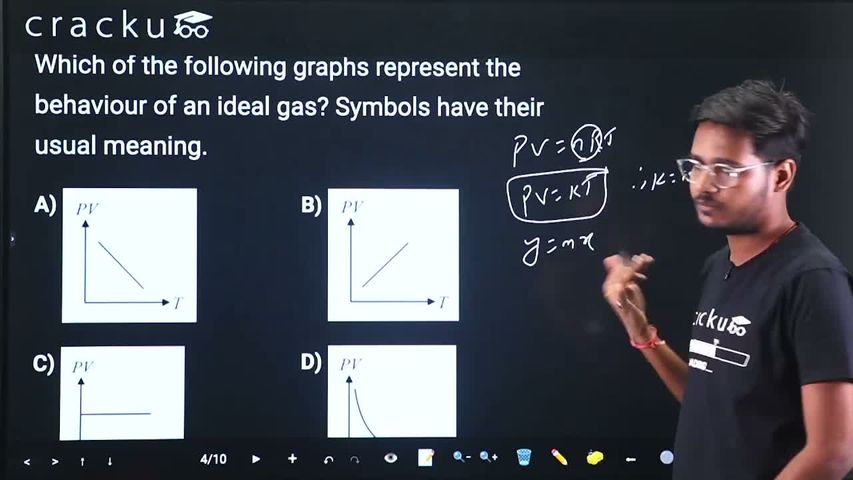
Which of the following graphs represent the behaviour of an ideal gas? Symbols have their usual meaning.
We need to identify which graph correctly represents the behavior of an ideal gas based on the state variables: Pressure ($$P$$), Volume ($$V$$), and Absolute Temperature ($$T$$).
The behavior of an ideal gas containing $$n$$ moles is universally governed by the ideal gas law equation:
$$PV = nRT$$
Where $$R$$ is the universal gas constant. For a fixed amount of gas ($$n$$ is constant), both $$n$$ and $$R$$ are constants. Thus, we can write:
$$PV \propto T \implies PV = k T$$
Where $$k = nR$$ acts as a positive proportionality constant.
Let's map our ideal gas relation to the standard mathematical equation of a straight line passing through the origin ($$y = mx$$):
Because the equation reduces to the form $$y = mx$$ with a positive slope ($$m > 0$$) and a zero y-intercept ($$c = 0$$), the graph of $$PV$$ versus $$T$$ must be a straight line pointing upward that extrapolates directly through the origin.
Final Answer: Option B
Click on the Email ☝️ to Watch the Video Solution
Create a FREE account and get:


Educational materials for JEE preparation

Ask our AI anything

AI can make mistakes. Please verify important information.
AI can make mistakes. Please verify important information.
